
BEAMTRACER · AUDIO ANALYSIS ENGINE
SEE THE STRUCTURE INSIDE YOUR SOUND
Explore spectrum, stereo, rhythm and loudness in BeamTracer. See what your track is doing, then route musical signals into visual controls in Viz.
Free to start · No credit card · Nothing to install
What can you do with the Audio Analysis Engine?
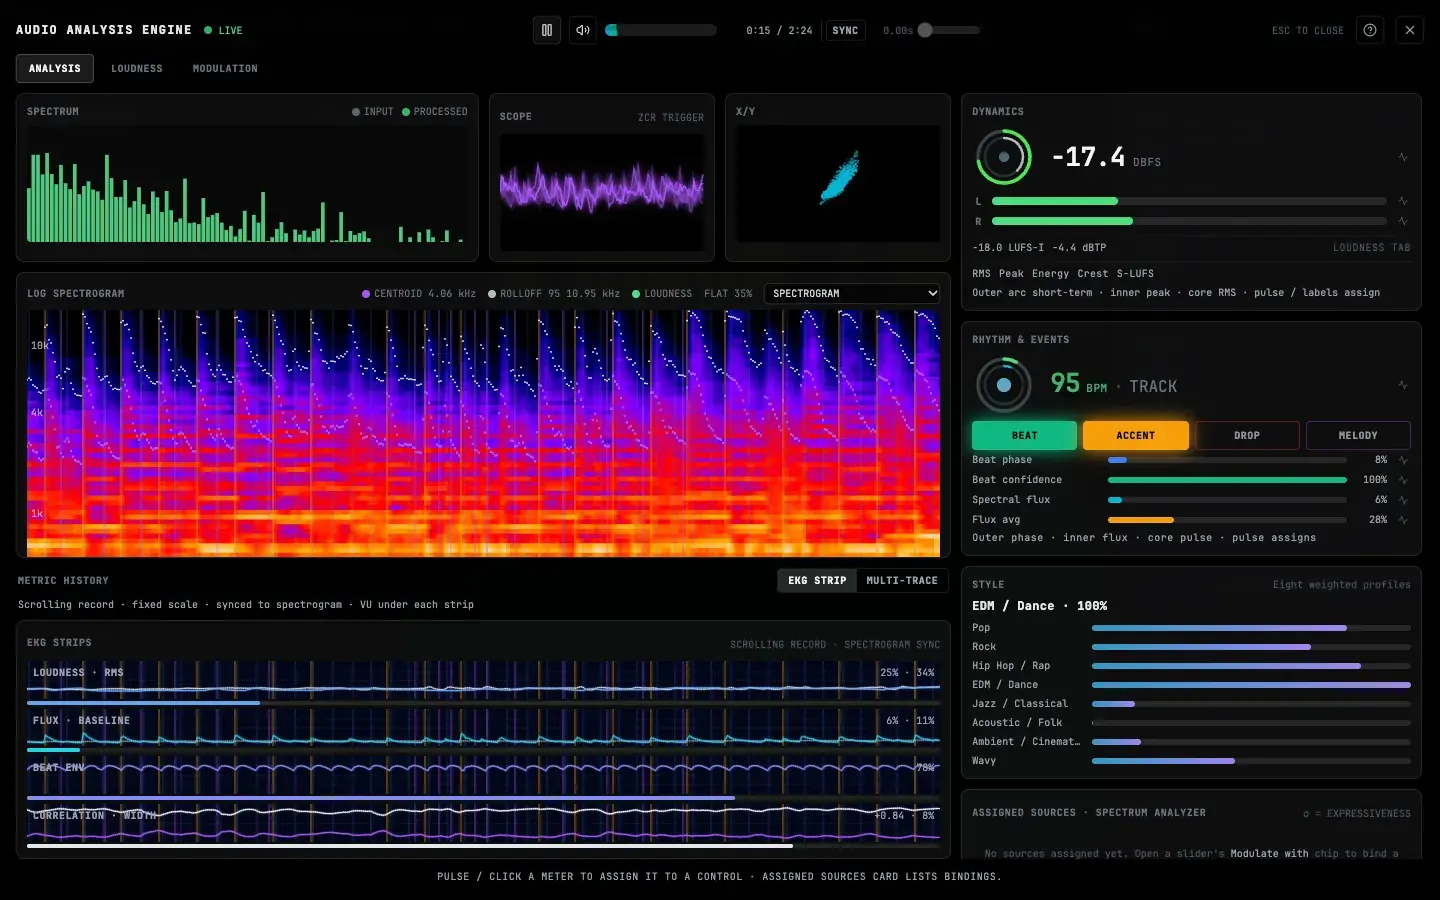
BeamTracer’s Audio Analysis Engine brings frequency, waveform, stereo, rhythm and loudness views into one browser workspace. Play a track to understand its changing energy, inspect the stereo picture, or check loudness. Then assign a musical signal to a visual control in Viz and watch your chosen movement follow the sound.
WHAT YOU CAN SEE AND DO
FIND THE PART THAT MOVES
Compare bass, mids and highs beside a scrolling spectrogram. See whether a phrase builds gradually or arrives as a sharp hit before choosing its visual response.
LOOK ACROSS THE STEREO PICTURE
Read left/right levels, balance and phase correlation alongside the X/Y view. Compare a narrow passage with a wider chorus instead of guessing from one overall level.
CHECK LOUDNESS OVER TIME
Switch to Loudness for momentary, short-term and integrated LUFS, true peak and loudness range. Analyze a file or follow a live source with history and target references.
TURN A READING INTO MOVEMENT
Assign a band, beat pulse or spectral signal to an available visualizer control. Use Modulation to inspect routes and save a patch for your next session.
TRY IT WITH YOUR TRACK
OPEN VIZ AND START A TRACK
Try the demo track or load your own audio. Press A to open the Audio Analysis Engine.
FOLLOW ONE MUSICAL PHRASE
Watch the spectrum, history and rhythm together. Switch to Loudness when you want a level measurement.
CHOOSE A VISUAL RESPONSE
Click an assignable meter and choose an available control, or open Modulation to build and save your routes.
THE ANALYSIS BEHIND THE VIEW
- Workspace
- Analysis · Loudness · Modulation
- Audio sources
- Demo and local files · microphone · supported browser-tab capture
- Browser
- Chrome or Edge recommended; audio capture depends on browser and operating system
- Speaker mix
- Analysis processing shapes visual response; Mute and track SYNC affect playback
EXPLORE THE ENGINE
- Spectrum and Stereo AnalysisSee frequency balance, waveform shape, stereo width and changes over time in BeamTracer’s browser Audio Analysis Engine.
- Browser Loudness MeterCheck integrated, short-term and momentary LUFS, true peak and loudness range in BeamTracer. Analyze an audio file and compare against target references.
Choose a look in Audio Visualizers, learn audio modulation, or check audio source compatibility.
RELATED ARTICLES
- Music Frequencies Explained: See Bass, Mids and Highs LiveEvery band from 20 Hz to 20 kHz, where each instrument sits, and how to see bass, mids and highs on a free browser visualizer. Read EQ colors like a DJ.
- How to Make Winamp-Style Visuals React to Your MusicMake Winamp-style visuals follow your music in BeamTracer: map Bass to Spread, use an LFO for color, shape Spectral flux, and export an MP4 or WebM.
- How to Read a Loudness Meter: LUFS in Plain LanguageWhat LUFS actually measures, why it replaced RMS, and what momentary, short-term, integrated, true peak and LRA mean — explained on a free browser meter.
FREQUENTLY ASKED QUESTIONS
The engine is a browser analysis and visual-control workspace. It does not provide paired plugin gain compensation, a mastering limiter or automatic correction of your mix.
No. Loudness measures the input before analysis processing. Analysis GAIN changes the response used by the visualizers; it does not turn the LUFS meter up.
These views describe the audio signal. A microphone input is not a calibrated sound-pressure meter, and the engine does not report calibrated room SPL.
START WITH A SOUND YOU KNOW
Open the engine, play a track, and follow one phrase across the views.