
BEAMTRACER · AUDIO ANALYSIS ENGINE
SEE WHERE YOUR TRACK’S ENERGY LIVES
See frequency balance, waveform shape, stereo width and changes over time in BeamTracer’s browser Audio Analysis Engine.
Free to start · No credit card · Nothing to install
How do spectrum and stereo views help you understand a track?
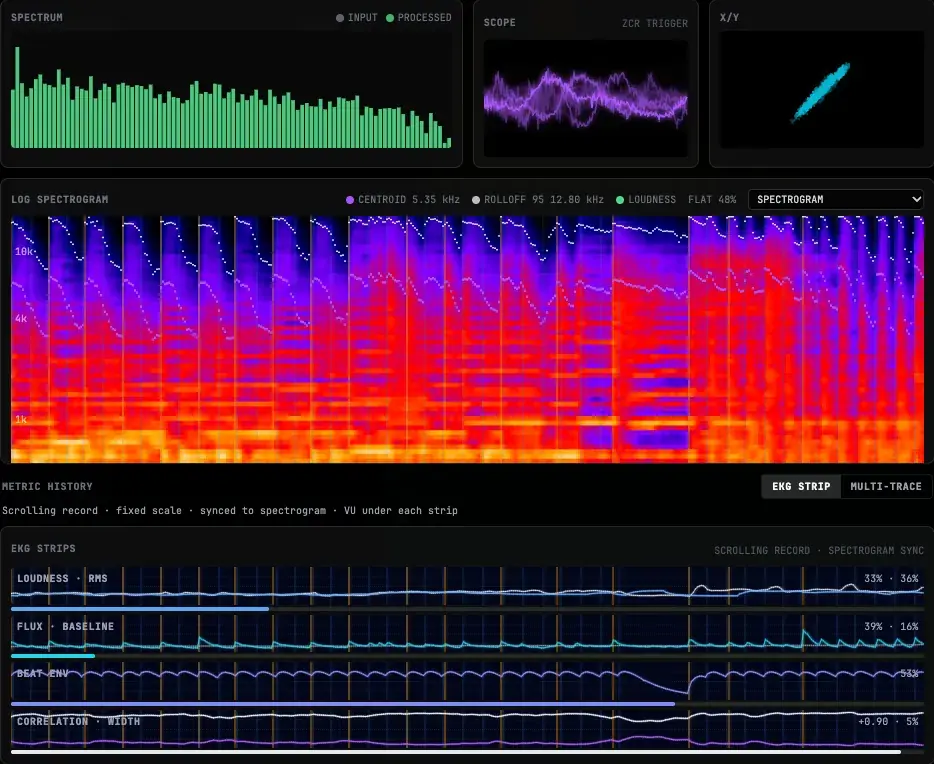
Spectrum and stereo views show different parts of the same sound. The spectrum reveals frequency energy, the waveform shows changes in the signal, and X/Y shows the relationship between left and right channels. Read them together in BeamTracer to identify contrasting passages and choose audio signals that suit your visualizer.
WHAT YOU CAN SEE AND DO
COMPARE INPUT AND RESPONSE
The spectrum separates Input from Processed. See how analysis processing changes the signal driving your visuals while keeping the original input in view.
READ A PHRASE, NOT JUST A FRAME
The log spectrogram shows frequency changes over time. Metric history helps you distinguish a sustained swell from short, repeated accents.
SEE LEFT AND RIGHT TOGETHER
X/Y, left/right RMS, balance, width and phase correlation offer complementary stereo views. A narrow or negative-correlation passage is a prompt to listen and compare.
MAP THE RIGHT MUSICAL DETAIL
Use Band energies to select a frequency region, or try spectral centroid for changes in brightness. Assign it to a supported control and watch the result beside the meters.
TRY IT WITH YOUR TRACK
PLAY A FAMILIAR TRACK
Open the engine with A and stay on Analysis. Start with a section whose bass, vocals or percussion you recognize.
COMPARE THE VIEWS
Watch Spectrum, Scope, X/Y and the spectrogram during the same passage. Check Stereo field for channel context.
ASSIGN AND LISTEN AGAIN
Click an assignable band meter, select a visual control, then replay the phrase to judge whether the movement fits.
THE ANALYSIS BEHIND THE VIEW
- Frequency views
- Spectrum · log spectrogram · Band energies · Spectral shape
- Stereo views
- X/Y · balance · width · phase correlation · mid/side · left/right RMS
- Spectrum detail
- FFT size choices from 512 to 8192; default 2048
- Interpretation
- A visual guide to the captured signal; listen alongside the displays
EXPLORE THE ENGINE
- Audio Analysis EngineExplore spectrum, stereo, rhythm and loudness in BeamTracer. See what your track is doing, then route musical signals into visual controls in Viz.
- Browser Loudness MeterCheck integrated, short-term and momentary LUFS, true peak and loudness range in BeamTracer. Analyze an audio file and compare against target references.
Choose a look in Audio Visualizers, learn audio modulation, or check audio source compatibility.
RELATED ARTICLES
- Music Frequencies Explained: See Bass, Mids and Highs LiveEvery band from 20 Hz to 20 kHz, where each instrument sits, and how to see bass, mids and highs on a free browser visualizer. Read EQ colors like a DJ.
- How to Make Winamp-Style Visuals React to Your MusicMake Winamp-style visuals follow your music in BeamTracer: map Bass to Spread, use an LFO for color, shape Spectral flux, and export an MP4 or WebM.
FREQUENTLY ASKED QUESTIONS
The analysis X/Y view shows the relationship between the left and right audio channels. OSC-1 is a separate BeamTracer workspace for oscilloscope music, drawing and output workflows.
They help you inspect the signal. The engine does not correct stereo polarity, rebalance a mix or replace listening in your audio editor.
When both channels contain the same signal, X/Y forms a narrow diagonal and stereo-width readings have little variation. Use a level or frequency source for more useful visual motion.
START WITH A SOUND YOU KNOW
Open the engine, play a track, and follow one phrase across the views.