
Audio Analysis Engine
Full-screen live analysis and modulation hub — every meter, every assignable source, generators, sync delay, and analyser controls explained.
The Audio Analysis Engine is the full-screen place to see what the music is doing and decide what should drive your visualizer.
Open it any of these ways:
| How | Detail |
|---|---|
| Keyboard | A toggles the engine on or off |
| Settings | Settings → Processing → AUDIO ANALYSIS ENGINE → OPEN |
| Close | Esc, or the X in the header |
Open the Audio Analysis Engine
Launches Audio Visualizers with the engine open — start a demo track and every meter comes alive.
The header shows Audio Analysis Engine, a green LIVE pill when analysis is connected, and CONDITIONING ACTIVE when global processing is not at defaults. The question-mark button in the top-right corner is context-aware help: it opens the documentation for whichever tab you are on — this page from Analysis, the Loudness Meter page from Loudness, and the modulation matrix page from Modulation.
Three tabs sit under the header:
- Analysis — spectrum, scope, spectrogram, history, dynamics, rhythm, style, bands, and more
- Loudness — broadcast-accurate LUFS metering with platform targets — see the Loudness Meter page
- Modulation — generators, channel rail, parameter board, patches (badge = how many controls are already bound)
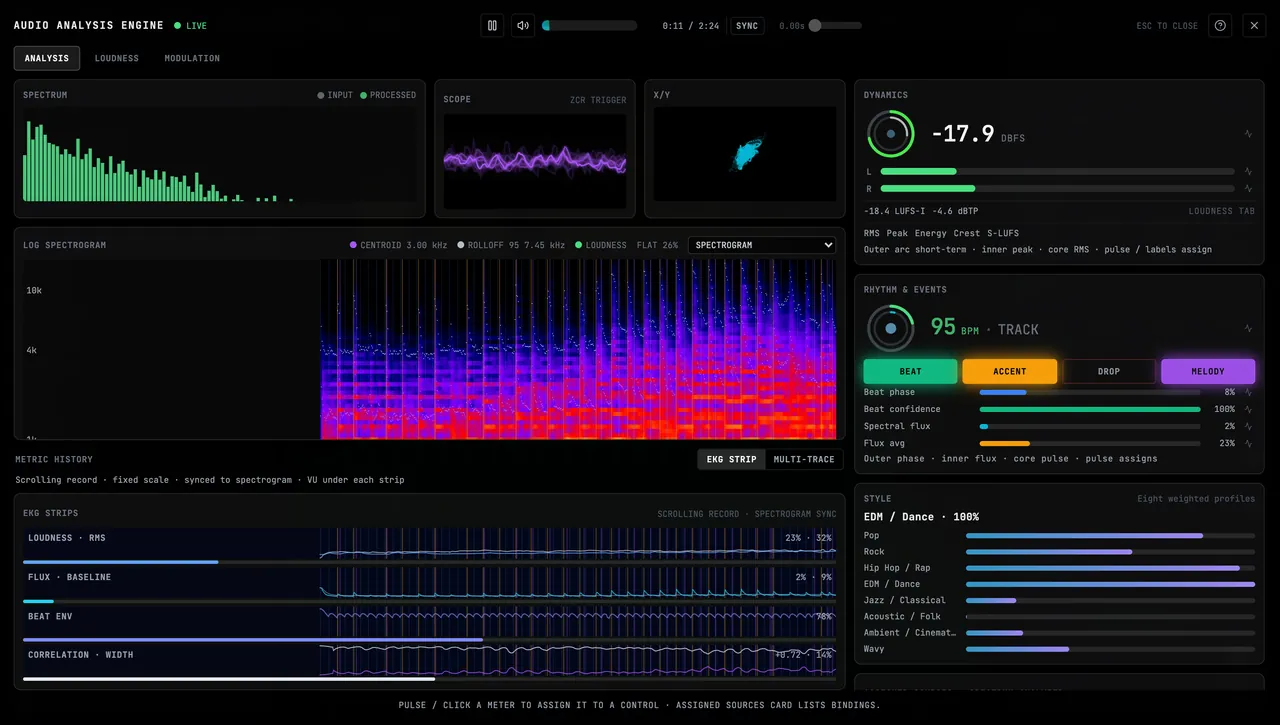
Explore what the Audio Analysis Engine can do for a practical overview and use cases.
Signed source meters show no fill when the source is unavailable. A measured negative value remains visible on the negative side of the meter.
Track transport (header)
When a file or demo track is the source, the header carries a compact transport:

| Control | What it does |
|---|---|
| Play / Pause | Starts or pauses the track |
| Mute | Mutes speakers only — visuals keep full analysis (same idea as Ctrl+M) |
| Scrubber | Seek by dragging. The cyan energy heat under the playhead fills in as the track plays (louder sections light up) |
| Time | Elapsed / duration |
| SYNC | Toggle for audio sync delay. Off = no delay (slider remembered). On = delays both what you hear and every analysis meter together (0–2.00 s) so sound can line up with heavier GPU scenes |
When to use SYNC: if the picture lags the kick by a fraction of a second on a heavy visualizer, turn SYNC on and nudge the slider until hits feel locked. Turn it off when you do not need it.
Mic and tab-capture sources do not show a full track scrubber; delay applies to file/demo track playback.
Analysis tab — left column
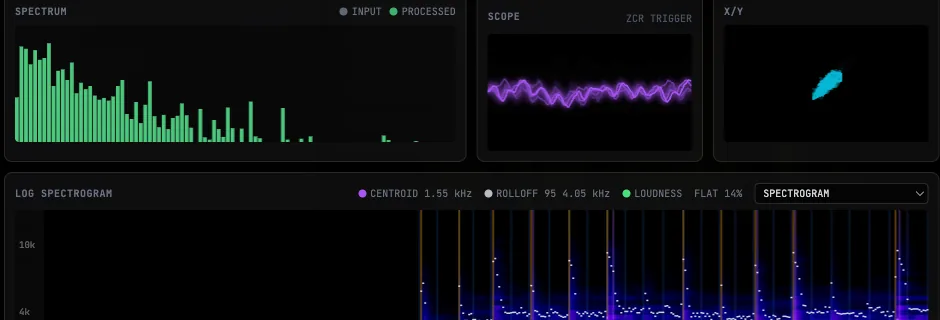
Spectrum (input vs processed)
| View | Meaning |
|---|---|
| Input (gray) | Raw spectrum before global processing |
| Processed (green) | Signal after Settings → Processing — what visualizers and modulation read |
If green bars hug the floor or clip the ceiling, fix processing first (OPTIMIZE or DB FLOOR / CEILING).
Scope
Phosphor-style waveform of the live time signal. Dense blocky traces often mean compressed material; tall spikes mean strong transients (good for Beat pulse and Peak routes). Silence sits as a flat line.
Optional ZCR trigger mode (when shown) restarts the sweep on zero-crossings so cycles stay readable.
X/Y
Left channel on X, right on Y (Lissajous). Thin diagonal ≈ mono; round cloud ≈ wide stereo; opposite diagonal can mean polarity issues.
Log spectrogram
Heat map of time × frequency (about 30 Hz–16 kHz). Curves on top typically mark centroid, rolloff, and loudness. Event marks can stripe on beats/accents/drops/melody.
Use the visualizer picker in the spectrogram header to load any catalog visualizer into the big canvas and watch it next to every meter.
Metric history
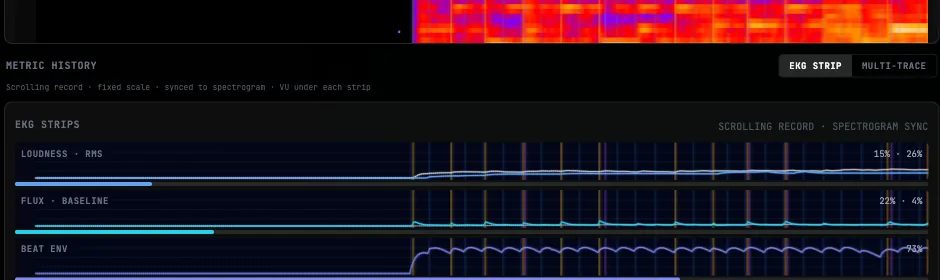
Grouped multi-trace strips (loudness, flux, beat envelope, stereo, and more). They answer how a signal moves over time — slow swells suit size/color routes; spiky traces suit flashes and kicks. Isolate or auto-range when the card offers those controls.
Analysis tab — right rail
Dynamics
Circular dynamics ring (short-term / peak / headroom style) plus L/R level context and dBFS-style readouts. Healthy program often sits roughly −20 to −10 dBFS; near −40 means the visuals are starving — raise GAIN or run OPTIMIZE.
Rhythm & events
Beat ring (phase sweep + confidence), the same session BPM as the settings-footer chip (click it or press T to tap-override), and event chips such as BEAT, ACCENT, DROP, MELODY. Related assignable sources include Beat pulse, Beat phase, Beat confidence, Accent, Drop, Drop intensity, Novelty, Percussive energy, Bass onset, Snare onset, Hat onset.
There is one tempo for the session. File and demo tracks get a whole-file reading (the same one Laser Animation Studio uses for beat grids). Microphone, tab audio, and live streams are followed as they play. T (three or more taps) overrides either; B is the Visualizer Bar, not a tempo key. See Tempo & Tap Tempo.
Style rankings
Live “what style does this moment resemble?” scores (e.g. energetic, ambient profiles). Use as a readout of the mix character; pick an assignable level/flux source for actual control motion.
Assigned sources
Lists which modulation sources already drive controls on the active visualizer — quick inventory without leaving Analysis.
Band energies
Compare frequency bands from Sub through Ultra. Click a meter (or its assign control) to start source → control assignment: pick the target control next.
Spectral shape
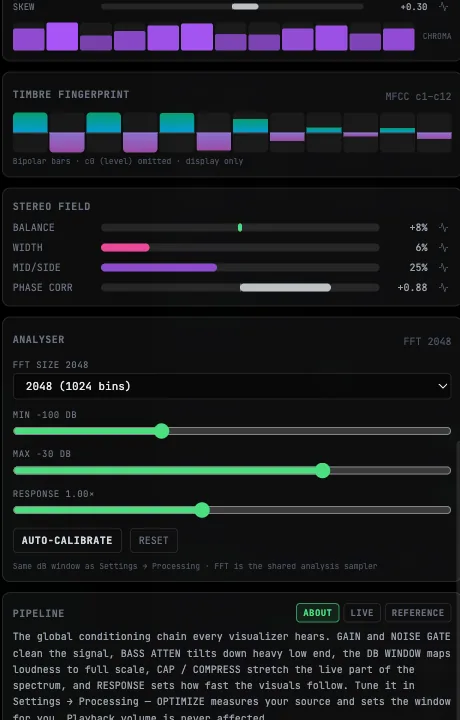
Centroid, rolloff 85/95, flatness, kurtosis, melody, skew, chroma bars — the timbre of the moment. Spectral centroid is the classic “brightness” assignable source.
MFCC fingerprint
Compact timbre fingerprint display (shape of the sound’s spectral envelope). Read-only context for matching material character.
Stereo field
Balance, Width, Phase correlation, Mid/side, Left RMS, Right RMS. Thin mono needle ⇒ stereo-width routes will not do much.
Analyser settings
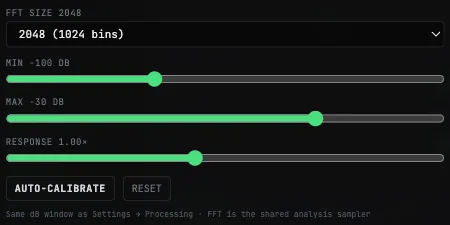
These edit the same global preferences as Settings → Processing:
| Control | Range / options | What it does |
|---|---|---|
| FFT size | 512, 1024, 2048, 4096, 8192 | Frequency detail. Higher = finer frequency detail, slightly heavier. Default 2048 |
| Min (dB floor) | −120 … −60 | Level that maps to “silence” in the spectrum window |
| Max (dB ceiling) | −80 … −10 | Level that maps to full scale |
| Response | 0.25× … 2× | How quickly band levels follow the music |
| AUTO-CALIBRATE | — | Listens a few seconds and sets floor/ceiling to your program |
| RESET | — | Restores default dB window, response, and FFT 2048 |
Min must stay below max by a few dB; the UI keeps a safe span.
Pipeline
ABOUT / LIVE / REFERENCE tabs: what the processing chain is doing right now, and quick facts (FFT, axis range, event definitions). Glance at LIVE when meters look “dead” — a gate or narrow window usually explains it.
Assign from a meter (Analysis → control)
- On Analysis, click / pulse-assign a meter that carries an assign action.
- The target picker lists modulatable controls on the active visualizer.
- Pick a control — that source is bound (same catalog as Modulate with on every slider).
- Esc cancels a pending assign without closing the whole engine (second Esc closes the engine).
Footer hint: Pulse / click a meter to assign it to a control.
Modulation tab
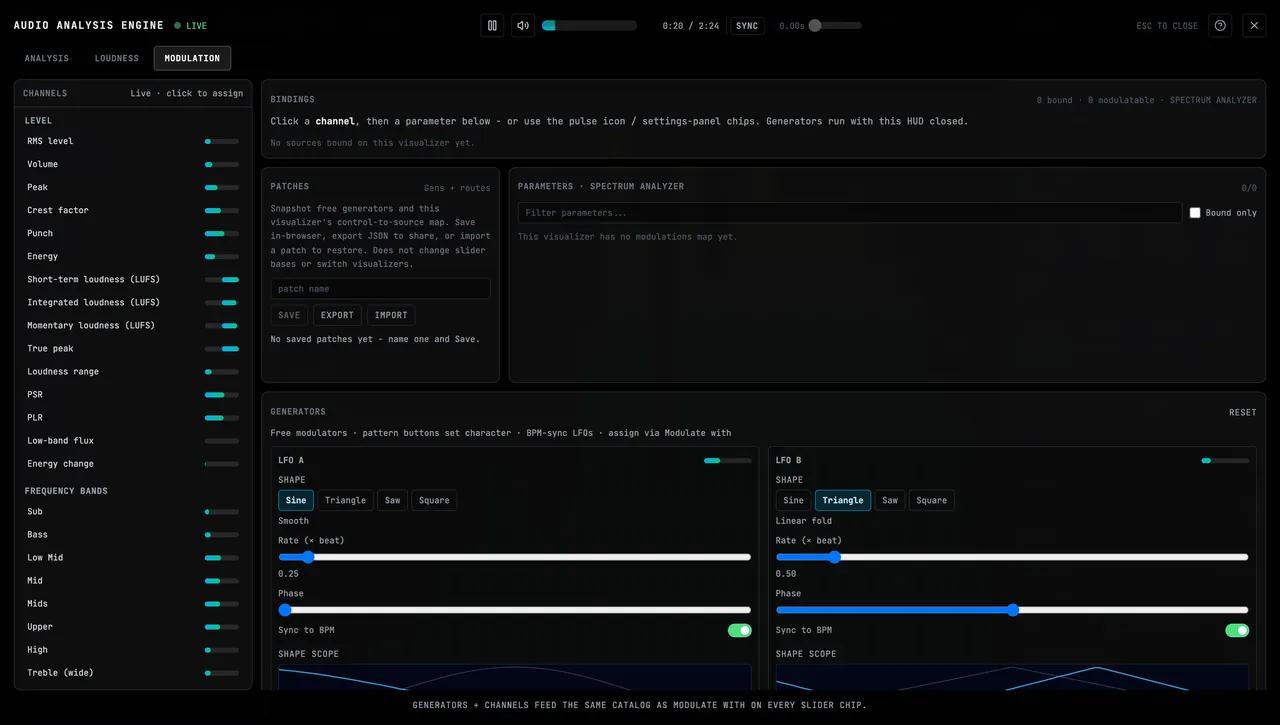
| Area | What you do |
|---|---|
| Generators | Configure LFO A, LFO B, Noise, Hold, Ramp (shape, rate, BPM sync where offered). Wave scopes show the live shape. Generators appear in Modulate with even with audio muted |
| Channels | Live list of assignable sources with level bars — pick a source to filter or bind |
| Parameters | Every modulatable control on the active visualizer; open Modulate with, set amount/algorithm when expanded |
| Patches | Save / load / export named modulation patches (local library) |
The tab badge is the count of bound routes on the current visualizer.
Complete assignable source catalog
Every row below can appear in Modulate with (settings chips and Modulation tab). Values are live 0–1 style levels for routing.
Level
| Source | What it measures |
|---|---|
| RMS level | Root mean square level across the current audio window |
| Volume | Smoothed overall level |
| Peak | Largest absolute sample in the window |
| Crest factor | Peak ÷ RMS — high = sharp transients |
| Punch | Peak minus RMS (scaled) — transient crest |
| Energy | Mean multi-band energy — spectral fullness |
| Short-term loudness (LUFS) | True 3-second BS.1770 loudness |
| Integrated loudness (LUFS) | True gated program loudness |
| Momentary loudness (LUFS) | True 400 ms BS.1770 loudness |
| True peak | Session-max inter-sample peak in dBTP |
| Loudness range | LRA — spread of short-term loudness (LU) |
| PSR / PLR | Peak-to-short-term / peak-to-loudness dynamics ratios (LU) |
| Low-band flux | How fast low-end energy is rising or falling, the same at any frame rate |
| Energy change | How fast overall energy is changing, the same at any frame rate |
Frequency bands
| Source | What it measures |
|---|---|
| Sub | 20–60 Hz |
| Bass | Classic bass / kick region |
| Low Mid | 250–500 Hz |
| Mid | Mid band (core “M” feel) |
| Mids | 500–2000 Hz musical mids |
| Upper | 2–6 kHz presence stack |
| High | High band (core “H” feel) |
| Treble (wide) | 6–20 kHz wide highs |
| Mid (500–1k) | Narrow 500–1000 Hz |
| Upper mid | 1–2 kHz |
| Presence | 2–4 kHz |
| Treble | 4–8 kHz |
| Air | 8–16 kHz |
| Ultra | 16 kHz–Nyquist |
Spectral shape
| Source | What it measures |
|---|---|
| Spectral centroid | Brightness center of the spectrum |
| Spectral flux | How much the spectrum is changing (onsets, hits) |
| Rolloff 85 | Frequency below which 85% of energy sits |
| Rolloff 95 | Frequency below which 95% of energy sits |
| Flatness | 0 ≈ pure tone, 1 ≈ noise |
| Spectral balance | High vs low energy tilt |
Rhythm
| Source | What it measures |
|---|---|
| Beat pulse | Envelope that spikes on each detected beat, then decays |
| Tempo | Estimated BPM |
| Beat phase | Position between last beat and next expected beat |
| Beat confidence | How stable the tempo lock is |
| Novelty | How unusual current flux is vs recent history |
| Percussive energy | Flux + low-end combined |
| Accent | Accent event hold |
| Drop | Drop event hold (loudness surge after a quieter stretch) |
| Drop intensity | Drop strength with bass weight |
| Bass onset | Low-end rise for kick-like onsets |
| Snare onset | A sudden rise in the mids with some highs, like a snare |
| Hat onset | A sudden rise in the highs alone, like a hi-hat |
Stereo field
| Source | What it measures |
|---|---|
| Balance | Left/right energy tilt (positive = right) |
| Width | Stereo width |
| Phase correlation | +1 mono-safe; near 0 very wide; negative can cancel in mono |
| Mid/side | Side RMS vs mid RMS |
| Left RMS / Right RMS | Per-channel loudness |
Timbre
| Source | What it measures |
|---|---|
| Spectral skew | Spectrum asymmetry about the centroid |
| Kurtosis | How peaked / concentrated the spectrum is |
| Melody | Sustained tonal content |
Generators
| Source | What it does |
|---|---|
| LFO A / LFO B | Free oscillators (shape, rate, optional BPM sync) — set in Modulation tab |
| Noise | Continuous random modulator (step / smooth / etc.) |
| Hold | Sample-and-hold |
| Ramp | Free-running ramp / saw / triangle / square family |
MIDI CC
Last value from common controllers (after the browser has MIDI permission from Settings / Learn). Group MIDI CC in Modulate with:
| Source | Typical use |
|---|---|
| CC 1 Mod wheel | Expression / depth |
| CC 2 Breath | Breath controller |
| CC 7 Volume | Channel volume |
| CC 10 Pan | Pan |
| CC 11 Expression | Expression pedal |
| CC 64 Sustain | Sustain pedal (often 0/1) |
| CC 71 Resonance | Timbre / resonance |
| CC 74 Brightness | Brightness / cutoff |
| CC 91 Reverb | Reverb send |
| CC 93 Chorus | Chorus send |
| Note velocity | How hard the last note was played (accented drum hits) |
| Note pitch | Which note was played last (low to high) |
Camera tracking
What the Performer's camera tracking sees, from the camera or video under the FX Rack. Picking one starts the tracking it needs. Group Camera tracking in Modulate with:
| Source | What it reads |
|---|---|
| Hand in view | 1 while a hand is tracked, 0 when none is in view |
| Pointing | 1 while the hand points with its index finger, as when drawing in the air |
| Fingertip X / Fingertip Y | Where the index fingertip is: across 0 left to 1 right, up 0 bottom to 1 top |
| Hand X | The first hand across the picture: 0 left, 1 right |
| Hand Y | The first hand's height: 0 bottom, 1 top |
| Pinch | Thumb and index fingertip together: 1 touching, 0 apart |
| Hand open | 0 a fist, 1 an open palm |
| Hand near | How near the hand is to the camera: 0 at 1.5 m or farther, 1 at 20 cm |
| Hand depth | The hand held toward the camera or back, against your face: 0.5 level with your face, 1 at half its distance, 0 at twice |
| Face in view | 1 while a face is tracked, 0 when none is in view |
| Mouth X / Mouth Y | Where the mouth is: across 0 left to 1 right, up 0 bottom to 1 top |
| Mouth open | How wide the first face opens its mouth |
| Head turn | 0.5 facing the camera, toward 0 or 1 as the head turns |
| Face near | How near your face is to the camera: 0 at 1.5 m or farther, 1 at 30 cm |
| Body speed | How fast the people in view move |
| Object count | Everyday objects in view (six or more reads 1) |
Opening Analysis alone does not prompt for MIDI permission; grant MIDI from MIDI settings or Learn first, then move a control to see the bar move.
A practical workflow
- Start your real track (or a demo), open the engine (press
A). - Check Dynamics + Spectrum — run AUTO-CALIBRATE or OPTIMIZE if levels are wrong.
- Watch one musical phrase on Metric history and the beat ring.
- Load your visualizer into the spectrogram canvas (or select it in the app first).
- Assign: either meter → control on Analysis, or Modulation / slider Modulate with.
- If the picture lags the kick, enable SYNC and nudge the delay.
- Save a patch on the Modulation tab if you want the map back later; presets also store assignments.
The engine never changes your speaker mix by itself except when you use Mute or SYNC (which delays track playback). GAIN and processing shape analysis only — see Audio Controls.
Related guides
Audio modulation
Slider chips, route amount, and assigning sources without the full-screen engine
Audio controls
Sources, VOL/mute, and every Settings → Processing slider
MIDI integration
Devices, learn, and hardware control
Music frequencies explained
What every band from 20 Hz to 20 kHz sounds like, and how to read it on the Spectrum, Band energies and Timeline
Audio Controls
Audio sources, microphone and device selection, and audio-reactivity controls in the Audio Visualizers app.
Loudness Meter
Broadcast-accurate LUFS metering — momentary, short-term, integrated, true peak, LRA, PLR/PSR, offline file analysis, measurement pause, platform targets with audition preview, overs counters, and BT Loudness Analysis. All of it free.