
Loudness Meter
Broadcast-accurate LUFS metering — momentary, short-term, integrated, true peak, LRA, PLR/PSR, offline file analysis, measurement pause, platform targets with audition preview, overs counters, and BT Loudness Analysis. All of it free.
The Loudness tab of the Audio Analysis Engine is a broadcast-accurate loudness meter built on ITU-R BS.1770-5 / EBU R128 — the same standard behind the meters mastering engineers pay for. Open it with A and switch to Loudness. Wherever you are in the Analysis Engine, the question-mark button in the top-right corner opens the documentation for the tab you are looking at — from the Loudness tab, it opens this page.
Everything on this page is free: every view, every platform preset, file analysis, the counters, and the exports.
Open the Loudness meter
Opens the Loudness tab directly. Start a track for live readings or choose ANALYZE FILE to measure a complete audio file.
The meter measures the raw audio, before changes made in Settings → Processing. Raising the analysis gain makes your visualizers react more strongly without changing the LUFS readings. The footnote under the graph confirms this.
Explore the browser loudness meter for a practical overview and use cases.
The readings
Integrated (I) is the headline numeral — the gated average of everything measured since the last reset, and the number streaming platforms use to decide how much to turn your track up or down. It colors by verdict against your selected target: green on target, amber quiet, red loud. Give it at least a chorus to settle.
M is momentary loudness (the last 400 ms — the "right now" number) and S is short-term (the last 3 s — how loud this section is). Their bars turn amber whenever the reading sits above the target band, so a too-hot section is visible without reading a single digit.
MAX M and MAX S hold the loudest momentary and short-term values of the session. Each one is a button: click it to reset just that maximum — handy after a soundcheck spike you don't want haunting the rest of the show.
True peak (dBTP) is the highest inter-sample peak, measured with the ITU 4× oversampling filter. Sample peaks can under-read the real analog peak by a dB or more; true peak is what platform ceilings (−1 dBTP, −2 dBTP) refer to.
The big numeral holds the session maximum and turns red the moment it exceeds the selected target's ceiling. The L / R bars are live — they follow the last three seconds so the meter always moves with the music. Click the numeral to reset the session max on its own, without touching anything else.
LRA (loudness range) measures how much the short-term loudness spreads over the session, in LU. A dynamic live set might read 15 LU; a brickwalled master reads 3–5. It needs about a minute of program before it stabilizes — the reading says "(settling)" until then, so you never trust a number that isn't ready.
PLR (peak-to-loudness ratio) is the session true peak minus integrated loudness — the whole program's headroom. A loud modern master usually lands around 6–8; a dynamic one 12–15. PSR is the same idea over the last 3 seconds, live; it turns amber below 8 LU, the point where loud sections usually start to read as crushed. PSR is a live reading only — a file session shows it as a dash. Every one of these has a pulse icon to route it into a visualizer control.
The history window
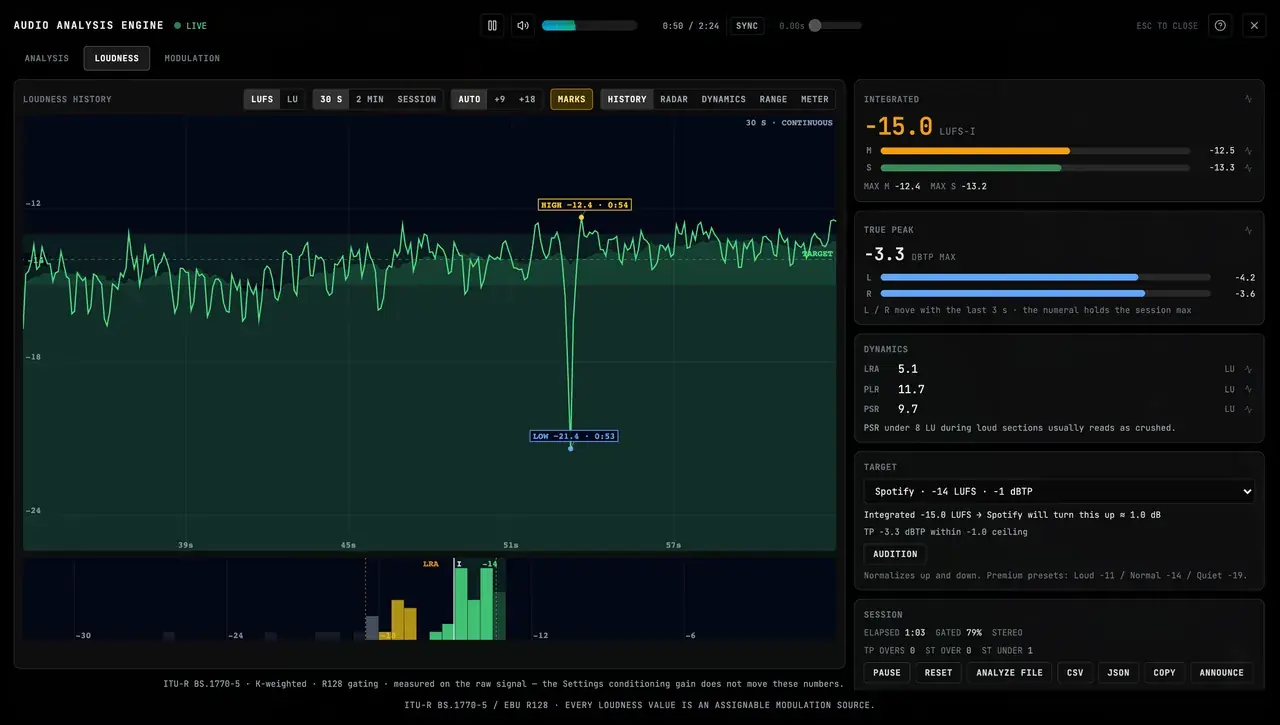
The big window on the left is the hero view, and every control above it does one job:
- LIVE | FILE appears once you have analyzed a file, and switches between the live measurement and the file session. Viewing a file session does not interrupt or reset the live measurement.
- LUFS | LU switches every reading between absolute LUFS and LU relative to the current target (EBU relative mode). At a −14 target, −16 LUFS reads as −2.0 LU and the graph's target line becomes 0 LU — you stop doing arithmetic and just steer toward zero.
- 30 S | 2 MIN | SESSION sets the time window. 30 S is the default — it is the liveliest read of what the music is doing right now. SESSION fits the whole measurement to the width, growing as the session grows, so a finished pass reads like a map of the set.
- AUTO | +9 | +18 picks the vertical scale. AUTO fits the program with a little padding and follows it smoothly, so the trace always uses the canvas instead of hugging one band of a tall fixed range. +9 and +18 are the two EBU-mode scales around the target — pick them when you want the axis to stay put for comparison.
- MARKS toggles the callout layer (below).
- HISTORY | RADAR | DYNAMICS | RANGE | METER picks the hero view. Your choice persists, and the views you are not looking at stay live as compact cards at the bottom of the rail — the corner of the screen is never dead space.
In the graph itself: short-term loudness is the filled area, momentary is the bright line, the target band is shaded with the target value called out on the axis, a time axis runs along the bottom, and red ticks along the top mark every slice where true peak exceeded the preset ceiling. Beneath it, the distribution histogram shows where your short-term loudness has lived on the same axis.
Point at anything: the hover inspector, MARKS, and scrollback
Hover anywhere on the graph and a crosshair snaps to the nearest data point with a chip reading the exact time, momentary, short-term, and that slice's true peak — in LU when you're in relative mode. On touch, press and drag for the same chip. The benefit is simple: you stop guessing what a wiggle was worth and read it.
MARKS pins the story onto the visible window: a HIGH callout on the loudest momentary point, a LOW callout on the quietest musical point (gated silence never wins — the low is your quietest passage, not a gap), and a small red flag on each true-peak over with a count in the corner. The callouts recompute as you change window or scroll, and nudge out of each other's way.
Drag left on the graph to look into the past — the header switches from CONTINUOUS to SCROLLED and a green FOLLOW chip appears; click it to snap back to the live edge. The meter keeps measuring the whole time.
The histogram — your loudness, as a distribution

Every 1-second short-term reading files into a bin, so over a session the histogram becomes the honest answer to "where does this mix live?" Bars are colored by distance from the target (green within ±2 LU, amber within ±4, slate beyond). The white I marker shows where integrated loudness landed inside the distribution, and the dashed LRA brackets show the retained range the LRA calculation actually uses — the dimmed bars outside them are the extremes the standard deliberately discards. A twin-peaked histogram is a set with two levels; a single narrow spike is a master with one.
Five views
HISTORY is the working view — everything in the section above.
RADAR is the at-a-glance view: short-term loudness writes a colored silhouette onto a disc over a one-minute rotation — blue when quiet, green in the target band, yellow and red as it runs hot — while the outer tick ring is a circular momentary meter with a peak-hold marker. Integrated sits in the center, LRA and session time in the corners, and a LEFT — STEREO — RIGHT strip with live per-channel true-peak bars sits below the dial. The PEAK lamp in the top corner blinks bright red for each true-peak over event and stays dimly lit for the rest of the session once one has happened — you can look away for a minute and still know.
DYNAMICS is a circular scope whose waveform trace glows green while PSR is healthy, amber as it approaches 8 LU, and red when the last few seconds read crushed — an instant is-it-squashed check you can read from across the room.
RANGE spreads the short-term loudness around the integrated level as a dotted band, fit to the session so far, colored by whether the loudness range reads flat (under 3 LU), moderate, or clearly dynamic.
METER is a split circular bar meter — short-term on the left half, integrated on the right, one bar per LU, green below the target line and red above it. The SHORT and INT chips in the middle carry the exact values.
Platform targets, your own target, and audition
Pick a platform in the TARGET card and the whole meter judges against it: the integrated verdict color, the amber-over coloring on M and S, the target band and LU zero on the graph, the histogram shading, and the counters below.
The card's normalization preview says exactly what the platform will do — "Spotify will turn this down ≈ 2.8 dB". Attenuate-only platforms (YouTube, Apple Music, Amazon) never show a "turn up" prediction, because they don't. And when a platform would boost a quiet track, the preview respects the true-peak cap: a −20 LUFS master peaking at −5 dBTP only gets +4 dB on Spotify and the card says exactly where it lands. The second line is the true-peak verdict against the ceiling.
AUDITION applies that predicted gain to your monitor path so you can hear what the platform will do — before you upload. The button lights green while active, and the note beside it states the guarantee: audition changes the monitor gain only, and every meter keeps reading the raw signal. It disables itself for presets that don't normalize and for file sessions.
The last entry in the selector is Custom: set your own target level (−36…−4 LUFS), a true-peak ceiling (−9…0 dBTP, or leave it empty for none), and a tolerance in LU. Everything downstream follows your numbers exactly as it would a platform preset — verdicts, previews, the LU zero point, scales, counters, audition. It persists across sessions, so a label spec or a house delivery standard becomes a one-time setup.
Your target also travels with you into Studio: the export NORMALIZE LOUDNESS option mixes the finished file to the target selected here (true-peak capped), so what audition previewed is what the export lands at.
| Preset | Target | TP ceiling | Notes |
|---|---|---|---|
| Spotify | −14 LUFS | −1 dBTP | normalizes up and down, on by default, album-aware; a limiter engages when a boost would exceed the peak ceiling; Loud −11 / Quiet −19 variants |
| Apple Music | −16 LUFS | −1 dBTP | Sound Check, off by default, down-only |
| YouTube | −14 LUFS | −1 dBTP | attenuate-only; the separate Stable Volume playback leveler is off for music videos |
| Amazon Music | −14 LUFS | −2 dBTP | attenuate-only |
| Tidal | −14 LUFS | −1 dBTP | album normalization, even in playlists; down-only |
| Deezer | −15 LUFS | −1 dBTP | down-only; listeners cannot switch it off |
| EBU R128 | −23 LUFS ±0.5 | −1 dBTP | broadcast delivery |
| ATSC A/85 | −24 LKFS | −2 dBTP | US broadcast |
| Netflix | −27 LKFS ±2 | −2 dBTP | reference only — Netflix measures dialog-gated |
| Podcast | −16 LUFS | −1 dBTP | −16 LUFS stereo, −19 LUFS mono |
| Club / None | no target | — | clubs, SoundCloud, Bandcamp, and social feeds don't normalize |
| Custom | yours | yours | your numbers, persisted |
Sourcing caveat: Spotify, Netflix, EBU R128, and ATSC A/85 targets are primary-sourced; the −14 cluster (YouTube / Amazon / Tidal / Deezer), podcast, and social values are community-verified consensus that platforms can change without notice. The full dataset behind these presets — with a source class and verified date on every row — is published at /loudness-targets.json and explained on the streaming loudness targets reference page.
Pause, counters, and the session
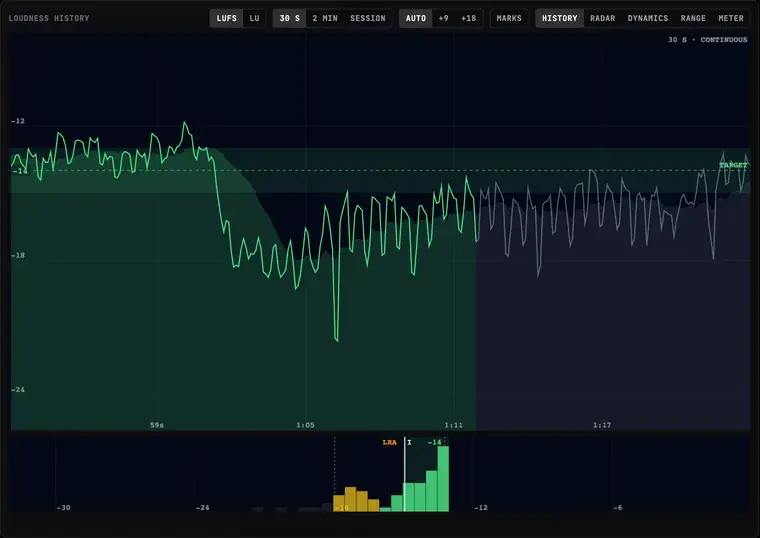
PAUSE excludes a stretch from the measurement — an ad break, talkback, a level check. While paused, the M / S and true-peak meters stay live so you can still see the signal, but integrated, LRA, the histogram, the maxes, the true-peak session max, and the session clock all freeze. The excluded stretch renders gray in the history so you can always see what was left out. RESUME continues cleanly — no stored measurement ever contains paused audio.
ELAPSED is measured audio time (pause stops it), GATED is the percentage of the session that survived the R128 gates (a very low number means you mostly measured silence), and the channel badge reads STEREO or MONO.
The counters are the alert layer: TP OVERS counts true-peak ceiling crossings (a sustained over counts once — it has to stay below the ceiling for a second before a new one can begin), and ST OVER / ST UNDER count excursions of short-term loudness beyond the target band sustained for at least five seconds, so a one-hit spike never spams the count. The numerals flash while an event is in progress — red over the ceiling, amber over the band, blue under it. Silence never counts as "under".
RESET clears the live measurement across the loudness views. Source changes reset automatically; seeking within a track does not. CSV and JSON download the full 1-second timeline (with a paused column) plus the summary and counters; COPY puts a numeric summary on the clipboard ready for notes, a client email, or a video description; ANNOUNCE speaks the headline readings to your screen reader on demand — the fast numerals are deliberately not chatty on their own.
Analyze a file — the full-track answer in seconds
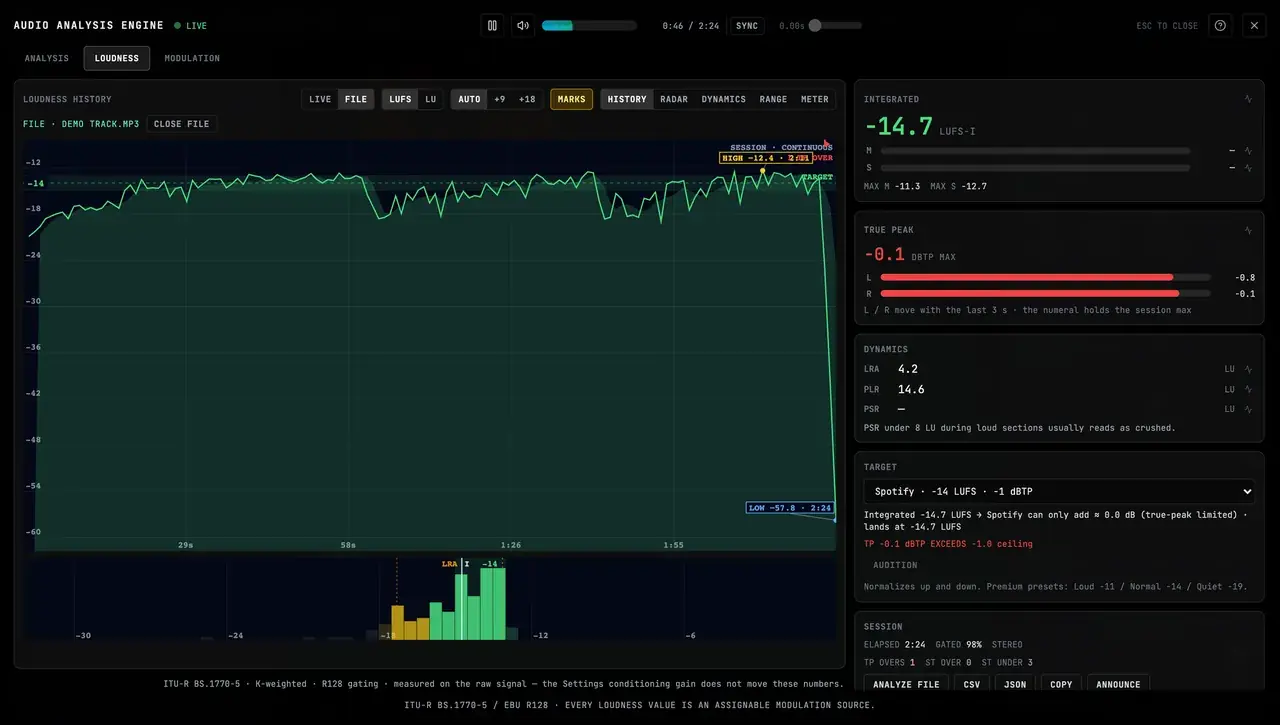
A live meter needs a full realtime pass before integrated loudness means anything. ANALYZE FILE skips the wait: click it (or drop an audio file anywhere on the tab) and the meter measures the entire file on your device — a 3-minute track takes a couple of seconds, with a progress percentage while it runs. Use any format your browser can play: WAV, FLAC, MP3, AAC, OGG.
The result is a FILE session: the whole track fit to the window, the histogram, integrated, LRA, true peak, PLR, the counters, the verdict and normalization preview against your target — everything the live meter shows, plus MARKS and the hover inspector over the full timeline. The FILE | LIVE switch appears in the header, the file's name shows in the chip, and CLOSE FILE drops the session. The live measurement keeps running untouched behind it the entire time, and if no audio is even playing, the "not measuring" screen offers Analyze a file instead.
FILE and LIVE use the same measurement standard and agree on the same audio. Exports and BT Loudness Analysis work on whichever session you're looking at.
BT Loudness Analysis
ANALYZE SESSION turns the measurements into a diagnosis, instantly and on your machine. Each finding is plain language with the exact numbers and time ranges behind it: true-peak overs with their timestamps and the worst overshoot, where the mix sits against the target (and precisely what the platform will do about it), unused clean headroom, heavily limited stretches located in time by PSR, loudness-range health, and validity notes for short or mostly-silent measurements. Healthy results are reported too — the card tells you what's working, not just what isn't.
For a live session, pause first so the numbers freeze — the card reminds you.
AI REPORT sends those findings and summary metrics — never your audio — to build a prioritized action plan: what to change first, what it's worth, and what's already right, each point citing your measured numbers and timestamps. Add an optional line of context ("techno for Spotify") to tune the advice. The report streams in below the findings and joins the JSON export and COPY summary, marked as generated content.
AI reports draw from a daily allowance that scales with your plan; when it runs out, the findings above are always complete — the measured findings remain available. And as the card's own footer says: this is AI narration of the measurements above — guidance, not mastering gospel. The findings are the measurements.
Level a livestream or voice chain
The meter works on live input (microphone or tab audio from Settings → Audio) exactly as it does on a track, which makes it a free multi-host leveling tool:
- Set the target to EBU R128 (−23 LUFS) — the broadcast speech reference, not a published livestream requirement — or a Custom target your platform prefers (−16 LUFS stereo / −19 mono for a podcast).
- Switch the readings to LU so every number is relative to the target and "correct" reads as 0.
- Have one person talk at a time at their normal level for 30 seconds or so, everyone else muted.
- Read their integrated offset, adjust their gain until it sits near 0 LU, then press RESET and do the next person.
- Watch ST UNDER during the show — a climbing count means someone has drifted quiet.
BeamTracer's live input has echo cancellation, auto gain, and noise suppression disabled for the analysis path, so the numbers describe the real signal, not a browser's processed version of it.
Assigning loudness to controls
Every loudness value is a modulation source. Click the pulse icon next to any readout to assign it to a visualizer control, exactly like the meters on the Analysis tab — see the modulation matrix. Short-term loudness makes a great slow "energy" driver; PSR inverts nicely into "crush" effects.
The LUFS Meter visualizer and the Studio loudness widgets show the same measurements — reset one and you reset them all. In Studio, each view is its own layer: LOUDNESS (history strip), LOUDNESS RADAR, LOUDNESS DYNAMICS, LOUDNESS RANGE, and LOUDNESS METER all appear in the audio-widget catalog with the usual hue and visual-gain looks.
Related
- How to read a loudness meter — the illustrated version of the readings: M, S, I, true peak, and LRA in plain language
- PSR, PLR and LRA explained — the DYNAMICS card and views on real masters, and why 8 LU is the line
- Spotify loudness normalization — the TARGET card's boost-cap arithmetic and AUDITION on a quiet master
- Streaming loudness targets — every platform, sourced, with the drag-to-see explorer
- Level livestream audio in the browser — the illustrated version of the leveling recipe
How accurate is this?
BeamTracer follows EBU Tech 3341 and 3342 for loudness and loudness range, and BS.1770-5 Annex 2 for true peak, with a ±0.1 LU measurement target. Even fully compliant meters disagree by about 0.2 dBTP on true peak, so leave half a dB of headroom below your ceiling.