
Getting Started with Audio Visualizers
Launch your first visualizer, connect audio, and start customizing in under a minute.
Audio Visualizers is the fastest path to stunning real-time visuals — no setup, no configuration. Open it, pick a visualizer, connect audio.
Prefer to watch? This ninety-second walkthrough covers everything on this page — from a blank tab to your first sound-reactive visual.
Step 1: Open the App
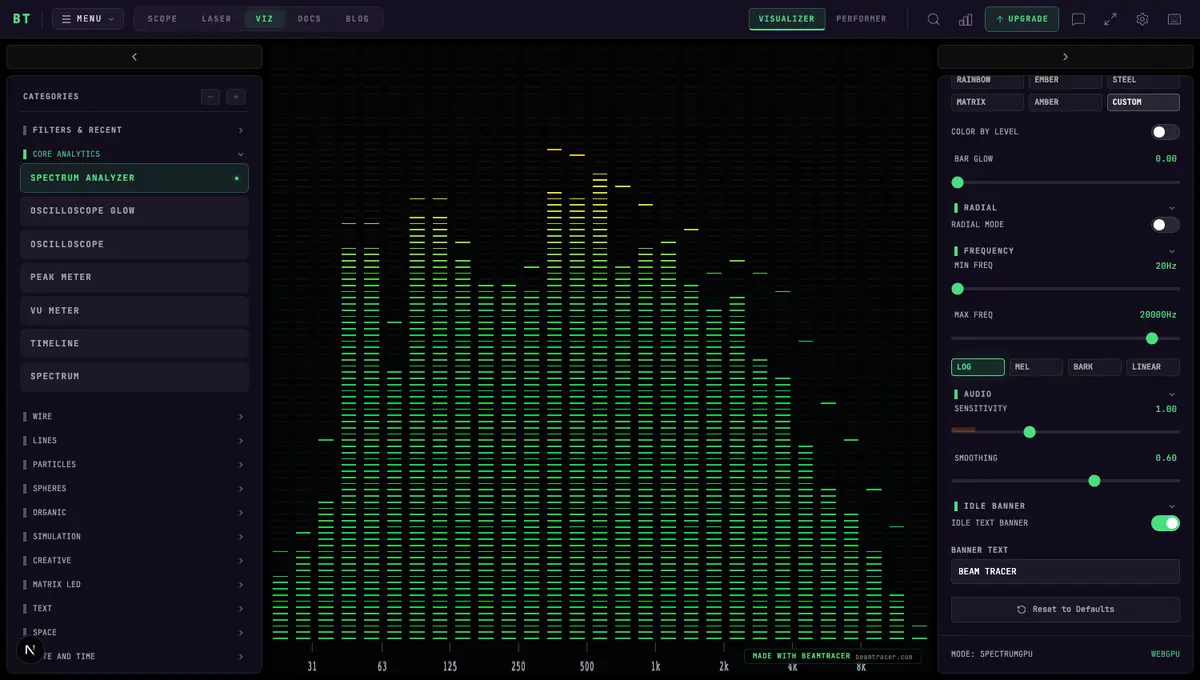
Navigate to /viz. You land in Visualizer mode — a category menu on the left, the live canvas in the center, and the visualizer's settings panel on the right. The Spectrum Analyzer loads by default; when no audio is playing it keeps a gentle demo wave running and periodically spells its idle banner text across the LED matrix. First-run hints walk you through these three areas.
Step 2: Pick a Visualizer
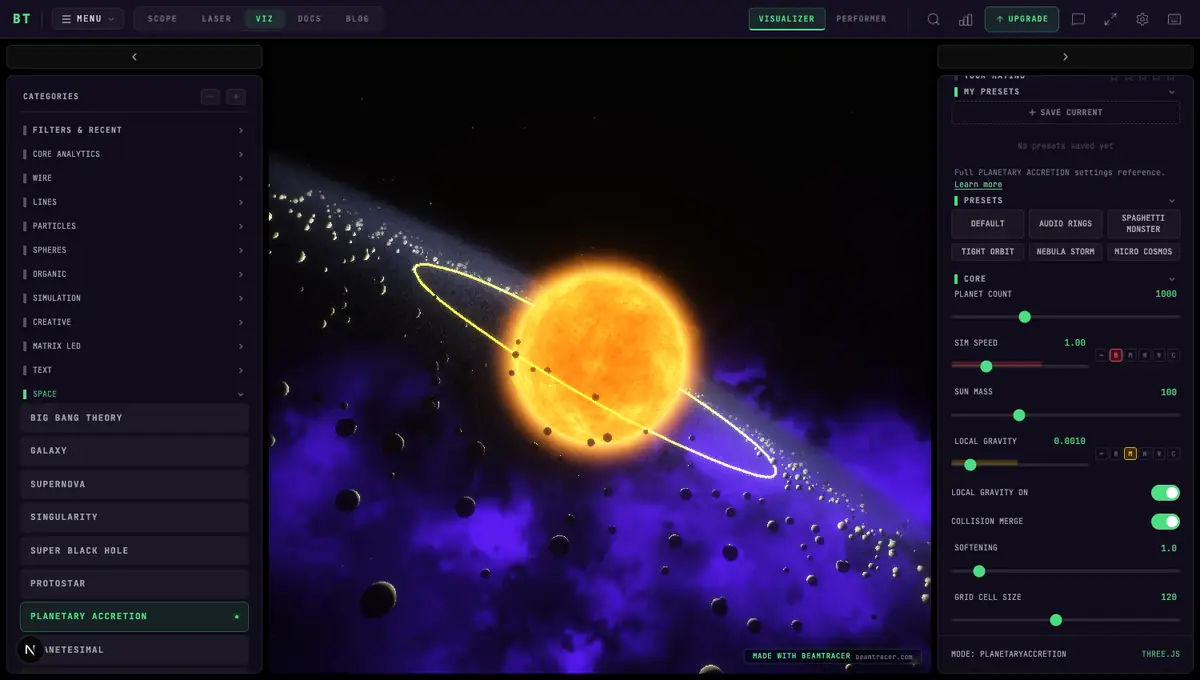
Browse the left panel: 196 visualizers in 15 categories, each shown as a thumbnail (the switch beside VISUALIZERS turns them into a list of names). Open a category, or type in Search visualizers, and click one to load it instantly. Bold? Try Marble Madness (Spheres) or Galaxy (Space). Minimal? Try Oscilloscope or VU Meter (Core Analytics).
You can also click the search icon in the header to open the visualizer search modal and find anything by name.
Some visualizers require WebGPU. Chrome and Edge are the tested choice; other browsers and devices vary by platform. See Browser Support and the category guide for the current details.
Step 3: Connect Audio
The quickest way: drag and drop an audio file (MP3, WAV, FLAC, OGG, AAC, M4A) anywhere onto the canvas — it starts playing immediately.
For everything else, open Settings → Audio (Ctrl/Cmd+K, or the gear icon):
- Demo tracks — pick one of the six bundled tracks and press play
- Upload / drop zone — load your own audio file
- Microphone — toggle live mic input and choose your input device (external interfaces and loopback devices appear here too)
A NOW PLAYING mini player appears at the bottom of the canvas with play/pause and seek controls. See Audio Controls for the full picture.
Step 4: Go Fullscreen
Press Ctrl/Cmd+F (⌘F on Mac). This is the best way to experience the visuals. Press Esc to exit.
Step 5: Customize the Look
The right panel holds the current visualizer's settings — colors, speed, effects, and audio-reactivity parameters. On a supported slider, use Assign modulation to choose a named source from Modulate with. See Customize.
Step 6: Try Performer Mode
Click PERFORMER in the header tabs to switch to the live-performance interface — a preset grid, tap tempo, scene sequencer, and MIDI controller support. Your audio keeps playing when you switch. See Visualizer & Performer Modes.
Step 7: Make a video in Studio
When you want a branded file — cover art, title, artist, synced lyrics, platform aspect — open Studio. It uses the same visualizer catalog. See BeamTracer Studio.
Deep Links
Every visualizer and mode is bookmarkable:
| URL | Opens |
|---|---|
/viz?v=jellyfish | The Jellyfish visualizer |
/viz?mode=performer | Performer mode |
/viz?v=galaxy&mode=performer | Galaxy, in Performer mode |
Missed the first-run hints? Open Settings → Display → Tips and click REPLAY TIPS, or Settings → Shortcuts → Show startup hints again, to play every tip again from the start. Show tips in the same place turns them off, or back on. The first time the camera controls appear (the FX Rack's SOURCE), a short set of tips walks you through turning on your camera, choosing one, mirroring, hand and face tracking, and getting good tracking.
Next Steps
Audio Visualizers
196 real-time audio visualizers with WebGPU, MIDI control, audio-band modulation, and a scene sequencer for live performance.
Visualizer, Performer & Studio
The three modes in Audio Visualizers — Visualizer for browsing and customizing, Performer for live shows, and Studio for branded music videos — plus the visualizer bar and dock.