
Spectrum Analyzer Bars
Build a radial frequency-spectrum display in Animation Studio using the Radial Bars visualizer mode.
A spectrum analyzer — bars that rise and fall with different frequency bands — is a staple of laser shows. In Animation Studio this is a built-in visualizer mode: Radial Bars arranges reacting bars around your host shape, with their movement baked into an ILDA animation.
What You'll Build
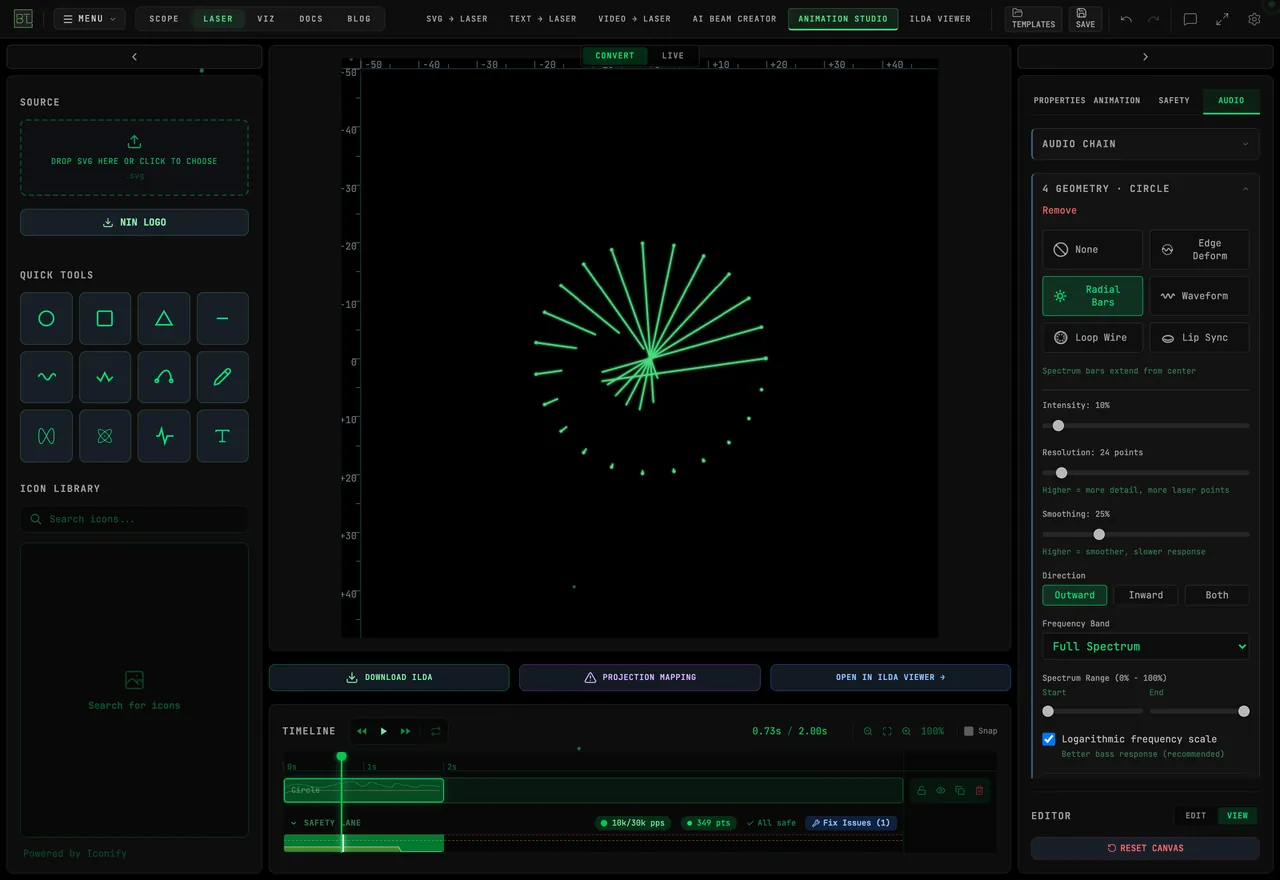
A ring of spectrum bars radiating from a circle — bass bands on one side sweeping around to highs — that pulses with your track and exports as a normal .ild file.
Step 1: Create the Host Shape
- Open Animation Studio
- Click the Circle tool in the Assets sidebar, then click the canvas to place it (or
⌘/Ctrl+Clickthe tool button to quick-place a centered circle) - Start with a small centered shape — this example uses width and height
10. Leave room for the bars to extend during louder moments
Radial Bars works on any layer, but smooth closed shapes read best.
Step 2: Load Your Audio
- Open the Audio Panel and upload your track (MP3, WAV, OGG, or M4A)
- Wait for the analysis to finish — you'll see the BPM and waveform
Step 3: Enable Radial Bars
- Select the circle layer
- Open the AUDIO tab, expand 4 GEOMETRY for the selected layer, and choose Radial Bars
Step 4: Tune the Bars
The visualizer settings control the look:
| Setting | What it does | Suggested start |
|---|---|---|
| Intensity | Strength of the bar reaction (5–100%) | 10 |
| Direction | Bars grow Outward, Inward, or Both | Outward |
| Resolution | Number of bars around the shape | 16–24 |
| Smoothing | Temporal smoothing — higher = smoother, slower decay | 25% |
| Band | Frequency focus: Full Spectrum / Bass / Mid / High | Full Spectrum |
You can also narrow the frequency range (start/end %) to zoom the display into the musically interesting part of the spectrum, and enable logarithmic frequency mapping so bass — where the energy lives — gets its fair share of bars.
Start with Intensity 10%, Resolution 24, and Smoothing 25%. This capture uses the Talk demo and a small host shape so the bars have room to extend.
Watch the loudest parts of your own track and reduce the shape size or reaction strength if the bars leave the preview. The Outward, Inward, and Both options change their direction.
Step 5: Preview and Export
- Press Play — the bars should pump with the track
- If the motion is jittery, raise Smoothing; if it feels sluggish, lower it
- Check the Point Budget / stress heat map — dense bar rings add scanner load
- Click Download ILDA — the file stores the fixed animation. Play it with the same track using compatible laser software and hardware
Tips
16–24 bars is enough. Higher resolutions increase scanner load significantly without adding visible detail at projection distance.
Logarithmic mapping is essential. Linear frequency bands give far too much space to high frequencies. Logarithmic puts more bars in the musically-important bass/mid range.
Layer it. Put a second, smaller circle inside with Radial Bars set to the Bass band and direction Inward for a two-ring analyzer. Remember the 10-layer limit.