
BLOG
Tutorials, guides, and updates from the BeamTracer team
Find articles for your workflow
8 articles for Audio Visualizers · Audio Analysis
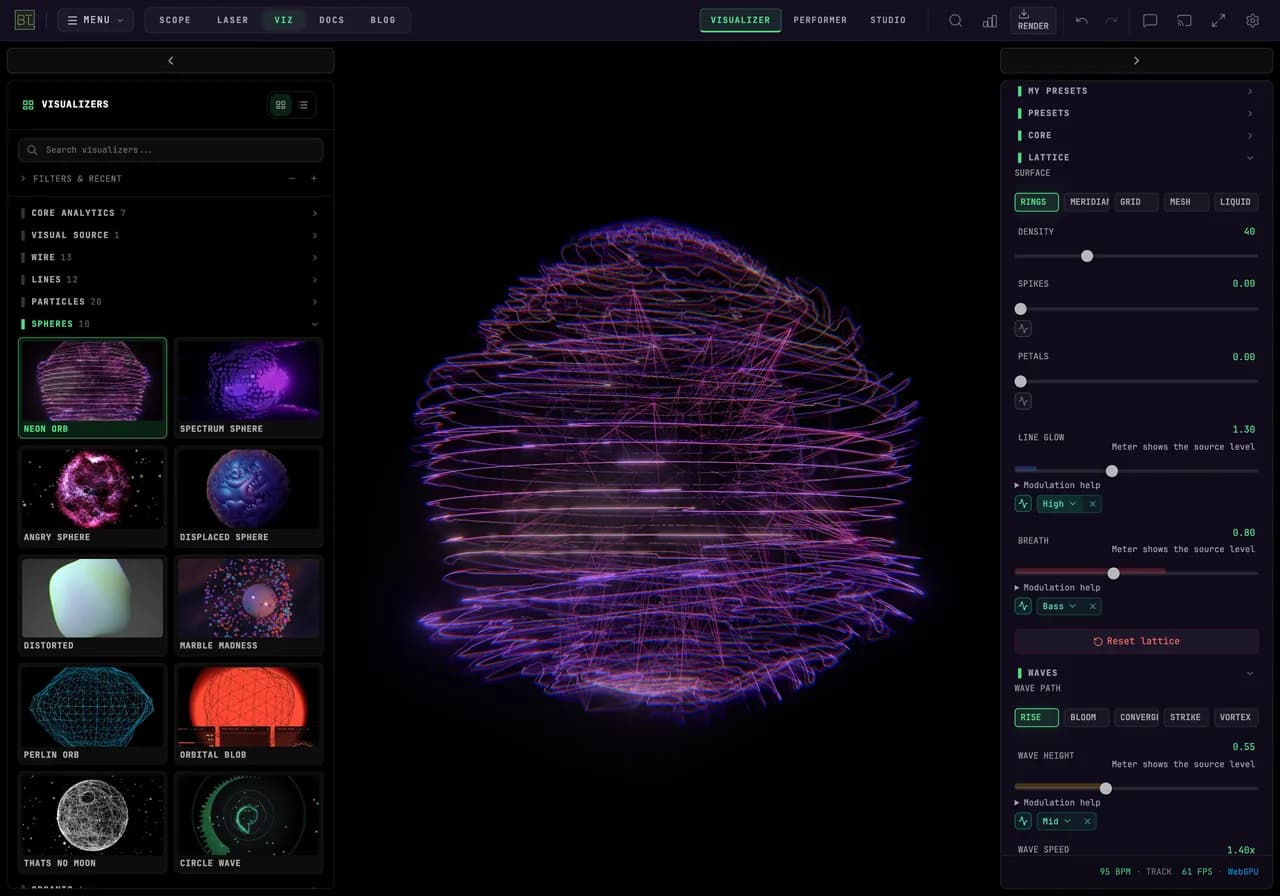
How Do I Make Bass, Mids and Highs Control Different Visual Effects?
Give bass, mids and highs different jobs in BeamTracer. Map Neon Orb's breathing, wave height and line glow, then tune each response while your music plays.

How to Make Winamp-Style Visuals React to Your Music
Make Winamp-style visuals follow your music in BeamTracer: map Bass to Spread, use an LFO for color, shape Spectral flux, and export an MP4 or WebM.
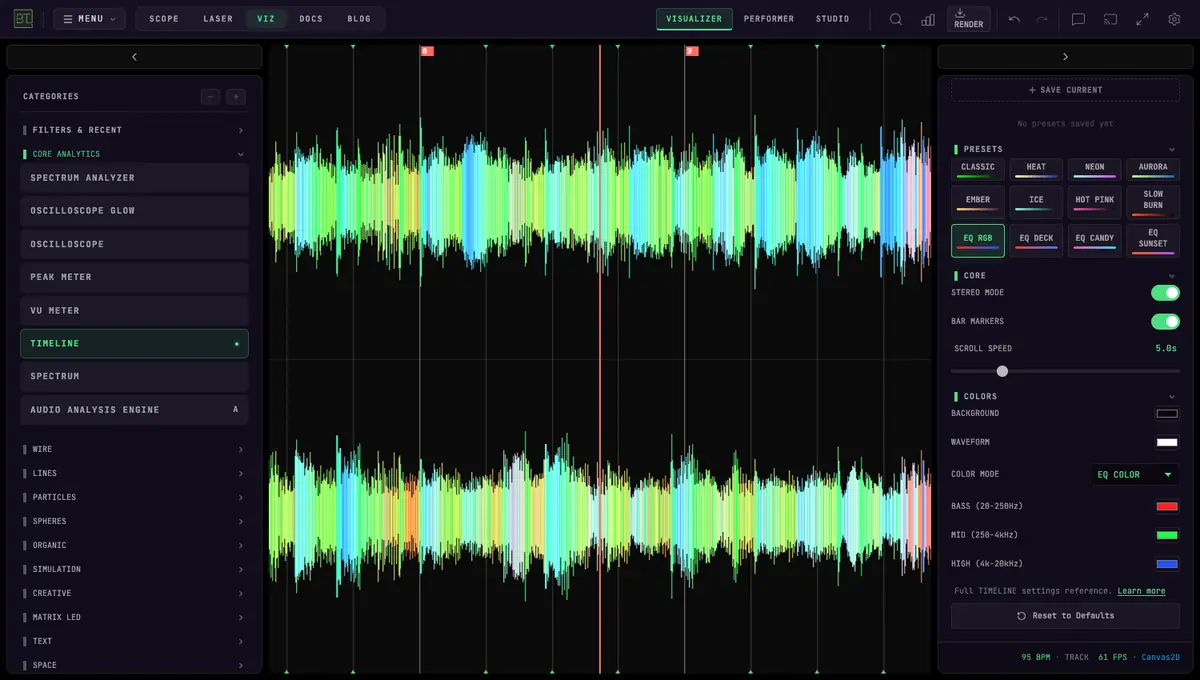
Music Frequencies Explained: See Bass, Mids and Highs Live
Every band from 20 Hz to 20 kHz, where each instrument sits, and how to see bass, mids and highs on a free browser visualizer. Read EQ colors like a DJ.
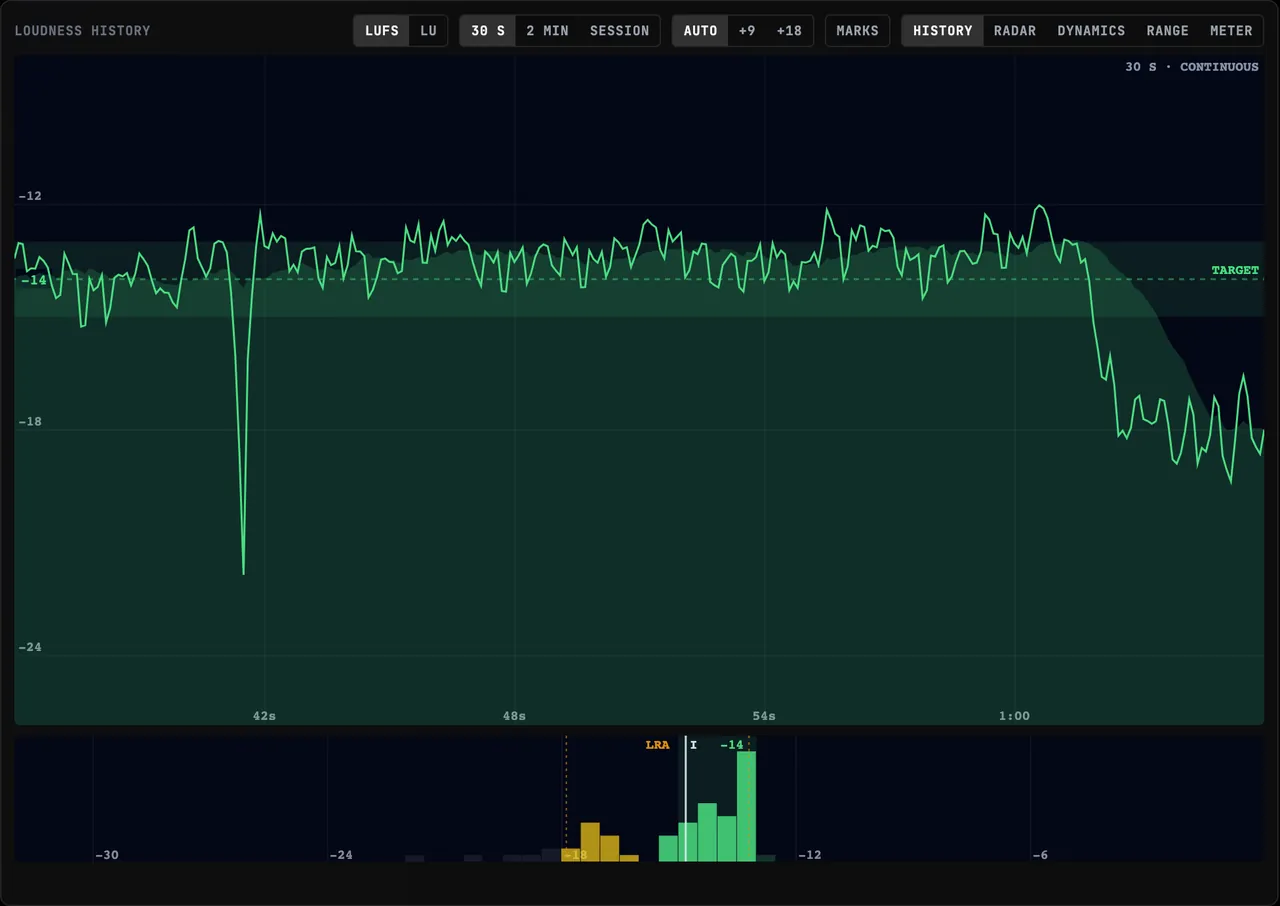
How to Read a Loudness Meter: LUFS in Plain Language
What LUFS actually measures, why it replaced RMS, and what momentary, short-term, integrated, true peak and LRA mean — explained on a free browser meter.
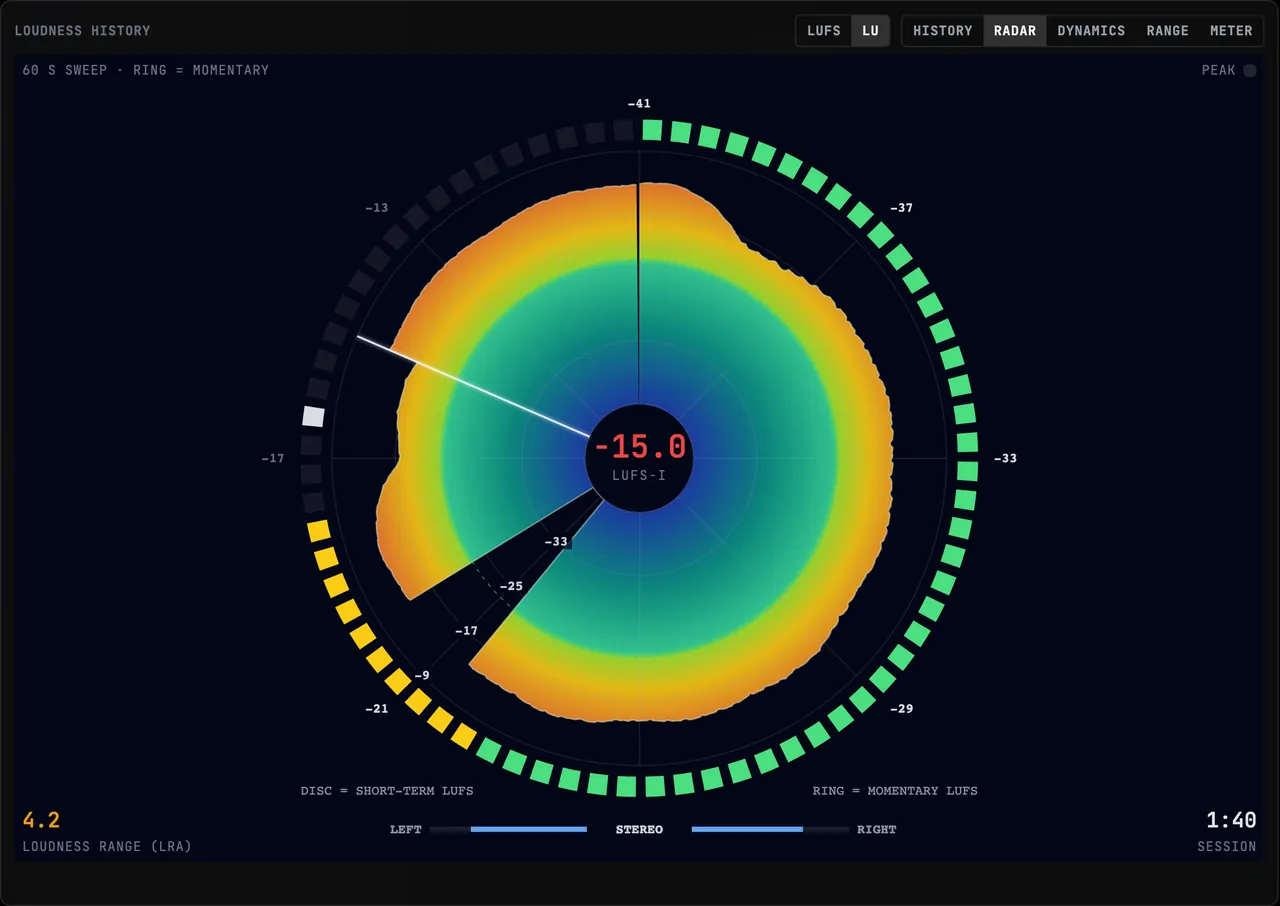
Level Livestream Audio in the Browser: No Second PC
The classic livestream loudness workflow needs a second machine and a capture app. Here's the same LUFS speech leveling done free, in one browser tab.
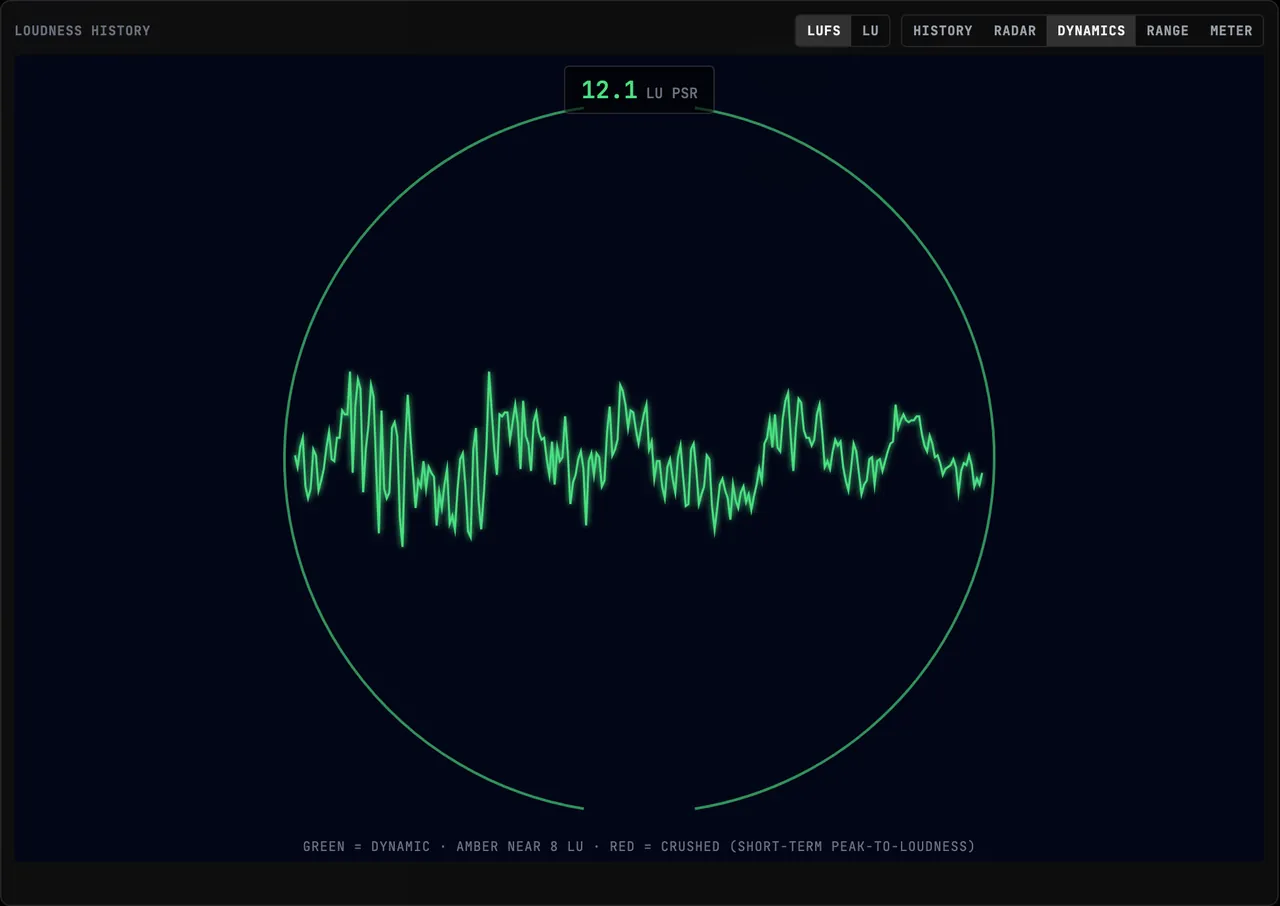
PSR, PLR and LRA Explained: How Dynamic Is Your Master?
Learn what PSR, PLR and LRA measure, how to interpret low PSR readings, and when to use live playback or whole-file analysis in BeamTracer.
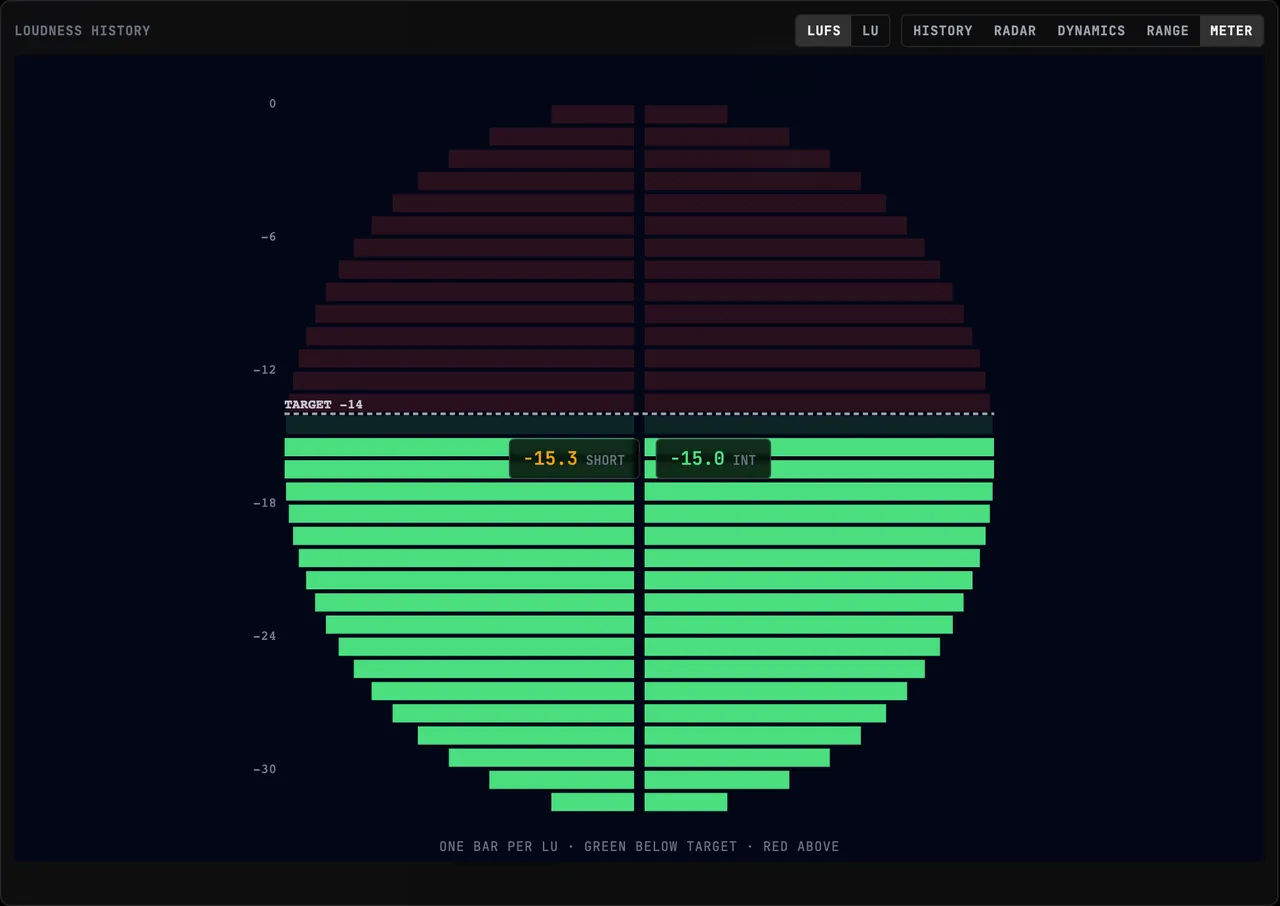
Spotify Loudness Normalization: What −14 LUFS Really Does
Spotify normalizes to −14 LUFS, but the boost is capped by true peak and turning down never clips. The real behavior, and how to preview it before upload.
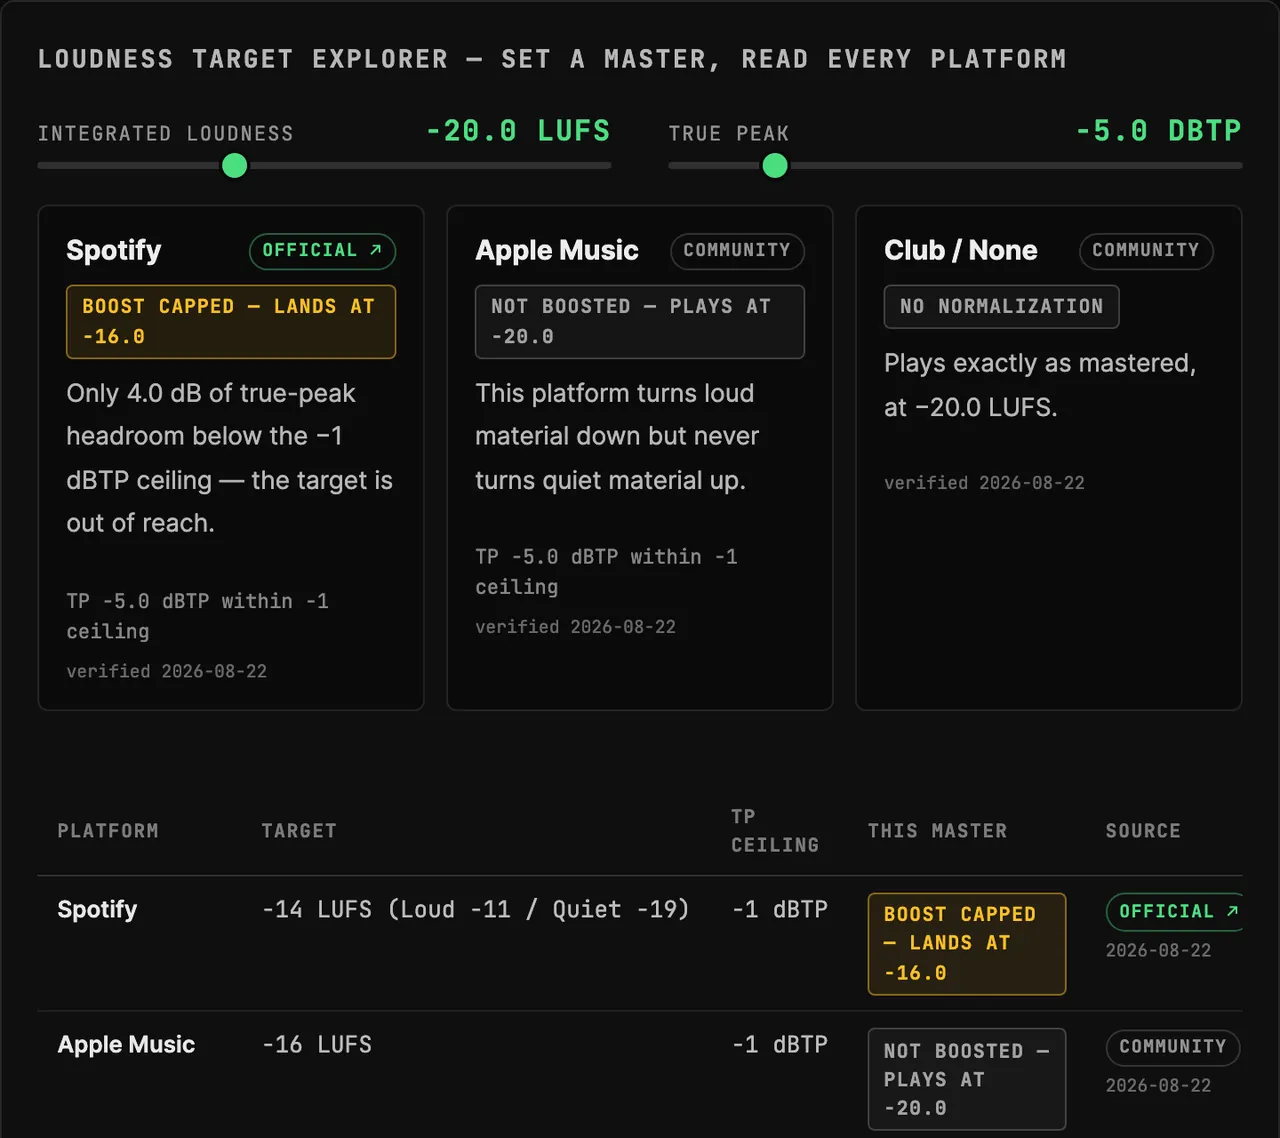
Streaming Loudness Targets: Every Platform, Sourced
Spotify, Apple Music, YouTube, Tidal and the rest: every platform's real playback numbers with a source class on each — plus a live loudness calculator.