
How Does Oscilloscope Music Work? Hear the Drawing
Oscilloscope music uses stereo audio as a drawing: the left channel controls horizontal position, and the right channel controls vertical position. Pitch sets how quickly those signals repeat; phase and waveform shape change the path. In BeamTracer Scope, generate both channels, hear their sound, and inspect the moving X/Y trace alongside time waveforms.
Press play to hear the drawing. These are Scope’s generated signals, recorded with their moving figures. There’s no added music. Start at a comfortable volume; the slow experiments below explain the motion before we move into musical pitch.
What do the X and Y axes represent?
In an X/Y audio display, X is one channel’s amplitude and Y is the other channel’s amplitude at the same instant. In these experiments, X is left and Y is right. A time waveform uses a different horizontal axis: elapsed time.
| Display | Horizontal axis | Vertical axis | What to notice |
|---|---|---|---|
| Main X/Y trace | Left-channel amplitude | Right-channel amplitude | Relationship between channels |
| SCOPE or SWEEP | Time | Channel amplitude | Individual oscillations and timing |
| SPECTRUM | Frequency | Signal strength | Fundamental and higher-frequency content |
Tektronix’s X/Y guide describes the same distinction for physical instruments. A note has no inherent horizontal or vertical direction: we assign the channels to those axes.
Turn on SCOPE beneath the large drawing, then MEAS in the panel header to check each channel’s frequency. SWEEP offers a single-channel time view; CH: LEFT switches to CH: RIGHT. SPECTRUM shows the frequency content.
The circle does not mean air molecules travel around a circle. Ordinary sound in air is a pressure wave; particles oscillate around their resting positions, as OpenStax explains. Scope plots the signals you supply.
How can I recreate these experiments in Scope?
Use Scope’s EXPRESSION generator with the coordinate formulas below. Start with Slow X only to establish the slow speed and continuous phase, then replace its X and Y expressions. Keep the remaining settings fixed so each comparison changes one idea at a time.
- Open Scope, choose PERFORMANCE, expand Generators, and open EXPRESSION.
- In PRESET, choose Slow X only under Harmony. This sets SPEED to 0.01× and enables CONTINUOUS PHASE. Selecting a preset starts its signal.
- Press STOP inside EXPRESSION, enter the chosen x = and y = formulas from the table, and leave z = empty. Keep T RANGE at 100%. These recipes do not use A or B.
- Choose VECTOR DISPLAY under Scope Presets, then set Persistence to +0.45 for the shown trail. Press GENERATE inside EXPRESSION. Turn on SCOPE → MEAS when checking audible frequency.
- Between experiments, press STOP, change the expressions, then press GENERATE. Press STOP when finished.
- Save the moving figure with its sound using EXPORT → VIDEO → RECORD LIVE INPUT → STOP RECORDING. Save a vector still with EXPORT → SVG → EXPORT AS SVG.
All rows use SPEED 0.01×, CONTINUOUS PHASE on, and an empty Z field. The formulas are ready to paste into Scope.
| Experiment | X expression | Y expression |
|---|---|---|
| Slow horizontal motion | 0.6*sin(t) | 0 |
| Slow vertical motion | 0 | 0.6*sin(t) |
| Slow circle | 0.6*sin(t) | 0.6*cos(t) |
| Audible line | 0.6*sin(220*t) | 0.6*sin(220*t) |
| Audible circle | 0.6*sin(220*t) | 0.6*cos(220*t) |
| Inverted line | 0.6*sin(220*t) | -0.6*sin(220*t) |
| Two summed tones | 0.35*sin(220*t)+0.25*sin(330*t) | 0.35*cos(220*t)+0.25*cos(330*t) |
| Slow square step | 0.55*square(t) | 0 |
| Slowly alternating circle | 0.3*sin(200*t)+0.5*square(t) | 0.3*cos(200*t) |
| Rapidly alternating circle | 0.3*sin(200*t)+0.5*square(20*t) | 0.3*cos(200*t) |
How does drawing speed become pitch?
A repeating coordinate signal becomes an audible tone when its repetition enters the audible range. The slow circle here completes one revolution per second. The audible circle completes 220 per second: each channel is a 220 Hz sine wave, the pitch A3.
Watch the leading trace travel. The 1 Hz motion is below ordinary musical pitch; headphones and speakers are not expected to reproduce a sustained 1 Hz tone. This slow recording retains its actual signal rather than adding a misleading soundtrack.
For the slow formula, increase SPEED from 0.01× to 0.02×: the revolution rate doubles. Doubling the audible circle’s speed raises both channels from 220 to 440 Hz, one octave, while preserving their phase relationship and circular path.
Three speeds matter. Signal frequency determines the tone. Screen redraw rate, shown by Scope’s HZ, determines how often the display updates. Laser point rate concerns physical scanning. They are different quantities. A complex figure can contain several coordinate oscillations before its complete path repeats; see the harmony lesson for that distinction.
Why can the same pitch draw a line or a circle?
Two matched sine waves draw a diagonal line when they are in phase. Move one channel a quarter-cycle ahead, keeping frequency and amplitude unchanged, and the trace becomes a circle. Other phase offsets generally produce ellipses; equal frequency alone does not guarantee a circle.
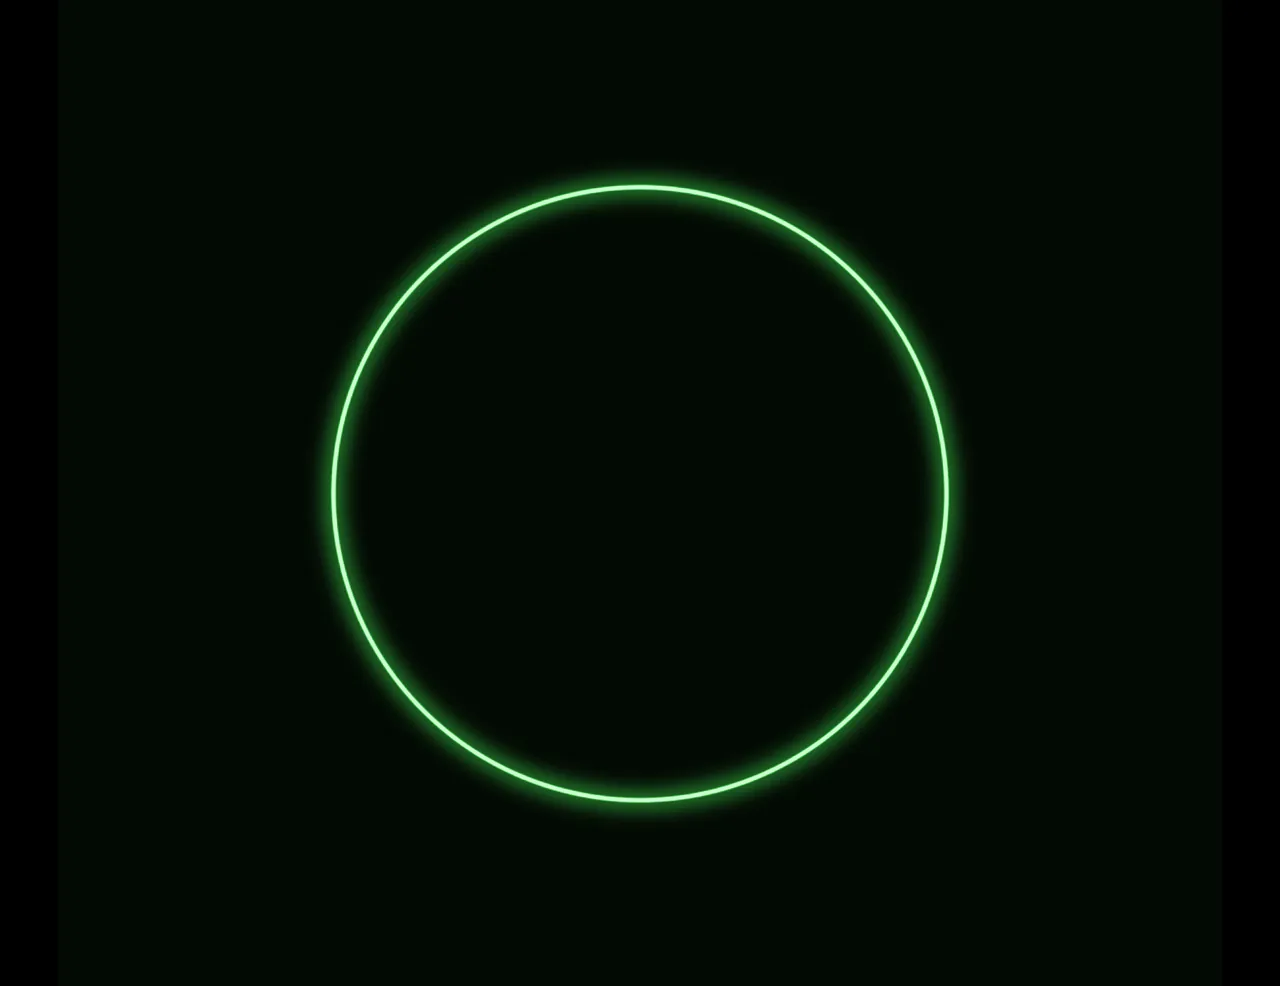
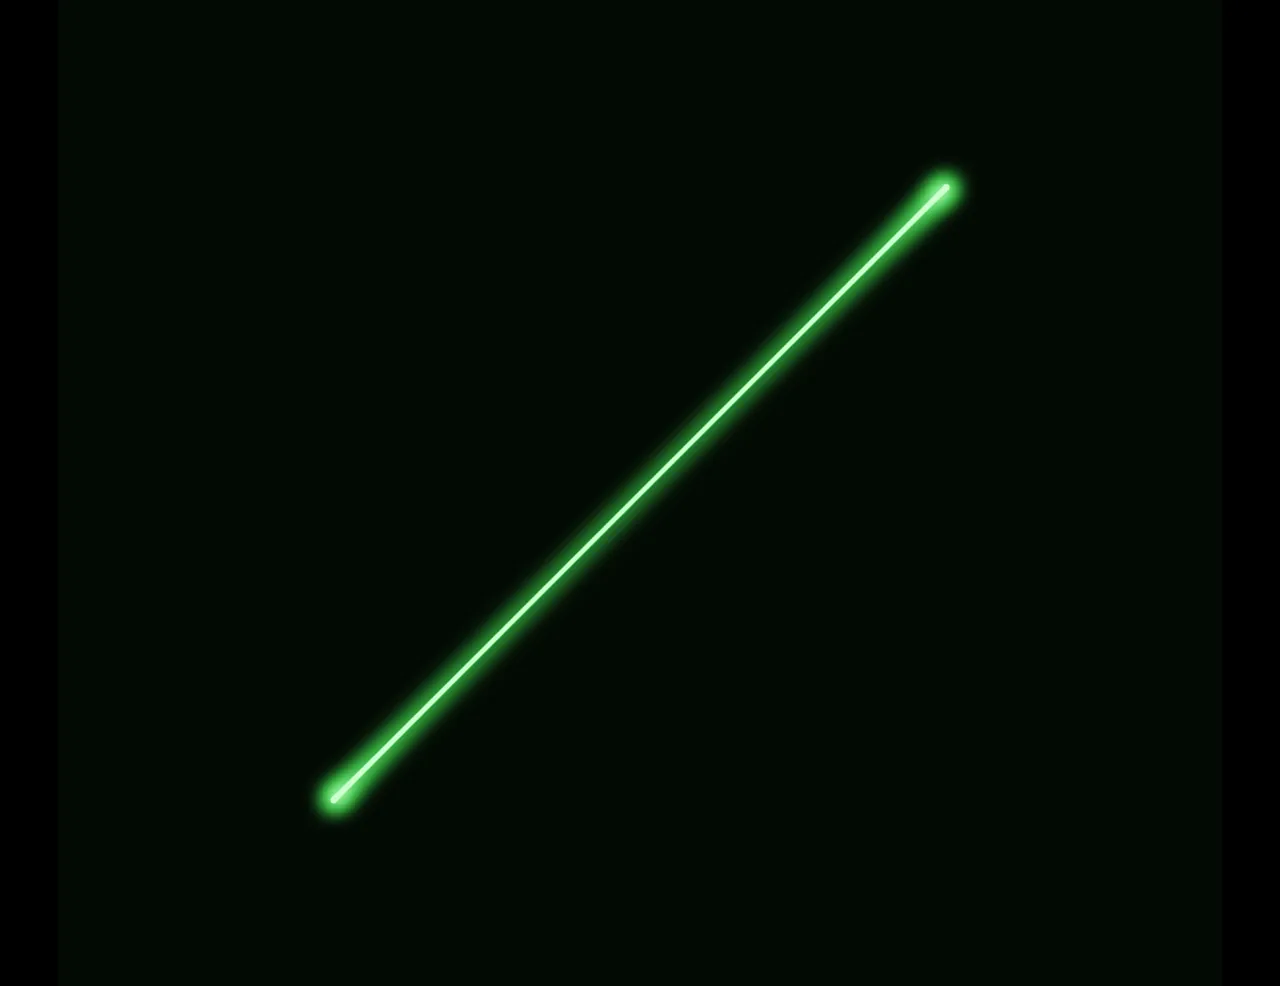 In phaseQuarter-cycle apart
The two hero experiments let you compare their sound. The pitch stays the same. Any perceived difference depends on playback: headphones keep the channels separate; speakers mix them acoustically in the room. Don’t use a dramatic change of shape as proof of a dramatic change of pitch.
Mono provides another test. If a player averages the matched channels, (L+R)/2, in-phase signals retain their amplitude, quarter-cycle signals retain about 71% of that amplitude, and perfectly inverted signals cancel. Real routing and speakers can change the result. Lower volume and compare carefully; the inverted recipe is a useful illustration of mono cancellation, not a promise that every playback system will go silent.
Why don’t two notes draw two separate circles?
Adding notes adds their amplitudes at each instant. The X/Y display receives one resulting X value and one resulting Y value, so it traces one compound path. It does not place a separate dot on the screen for each note.
The recipe combines 220 and 330 Hz, a just perfect fifth. Both frequencies occur in each channel; their cosine partners provide the quarter-cycle relationship used for the drawing. The path repeats 110 times per second, while the two component tones retain their own frequencies.
Try decreasing the 0.25 coefficient in both expressions. The 330 Hz component contributes less to the mix and the curve approaches the 220 Hz circle. Keep both channel changes matched. Stanford’s sound-synthesis explanation describes how sinusoidal components combine into more complex waveforms.
How can one trace appear to draw two circles?
A square-wave offset can move the center of a circulating trace between two positions. At slow switching rates, you see it take turns. At faster rates, display persistence leaves both positions visible. There is still one X/Y position at each instant.
The slow offset changes sign twice per second, so the circle spends half a second on each side. The fast recipe uses a 20 Hz square wave: its center switches 40 times per second. The 200 Hz circle makes five revolutions during each half-cycle of that square wave.
Change persistence as well as speed. A longer trail makes past positions remain visible. It changes how the signal is displayed, not how many independent signals exist. Visible bridges between positions depend on the signal transition and display treatment.
A square wave has abrupt transitions and higher harmonics. Those changes can produce clicks or a buzzy sound when combined with an audible carrier. A sawtooth instead ramps and resets; a triangle ramps in both directions. The DSP Guide’s harmonics chapter explains their different harmonic content. Digital signals and physical devices have finite bandwidth; an ideal instantaneous jump is not a promise about real hardware.
For more ways to organize separated shapes, continue with drawing two things at once.
Why might my trace look unstable?
Motion can come from the signal, display persistence, time-waveform triggering, or input processing. Check which view is moving before treating movement as a tuning problem. A switching offset should move; a quarter-cycle pair of matched sine waves should retain its underlying circular relationship.
Keep CONTINUOUS PHASE enabled for these comparisons. If a time waveform drifts, use Scope’s triggering controls. If a circle becomes an ellipse, check channel amplitude and phase. If a real audio chain loses the slow offsets, check its low-frequency response and coupling: AC coupling can remove DC and attenuate very low frequencies. Tektronix explains coupling and filtering.
A rotating camera changes a 3D view; it does not establish tuning drift. These experiments use 2D signals so the phase and offset comparisons remain easy to read.
Can I display my Scope drawing with a laser?
Yes. Scope offers laser output for supported devices, and an exported Scope SVG can become vector artwork in BeamTracer Laser. Begin with the circle as a simple handoff; inspect the laser preview and point budget before attempting physical projection.
- In Scope, generate the audible circle from the recipe table.
- Choose EXPORT → SVG → EXPORT AS SVG to save its vector drawing.
- Open Image to Laser and upload that SVG. Inspect the vector preview and POINT BUDGET using the Image to Laser guide.
- Use the documented laser-output setup for a supported device. Follow the laser safety guide before physical projection.
- Save the prepared laser artwork with DOWNLOAD ILDA when an ILDA file fits your playback workflow.
The SVG handoff preserves a vector still, not the original stereo soundtrack or its timing. A physical scanner cannot jump instantly between distant circles; blanking and motion limits matter. Previewing a circle on-screen does not certify projector safety or prove synchronized audio-and-laser playback. The oscilloscope-to-laser guide explains the output choices.
This lesson was inspired by DeltaFey’s oscilloscope introduction and follow-up on combined signals. The demonstrations here were created in Scope so you can recreate them. Start with the circle, change one variable, and compare what you hear with what the signal draws.