
What Harmony Looks Like: Hear the Shape of Music
To visualize harmony, send two notes to an X/Y oscilloscope. Their frequency ratio and phase draw a Lissajous curve. In BeamTracer Scope, generate the notes, hear them as the figure moves, and compare the drawing with each note’s waveform to explore tuning.
Press play to hear the shapes. A perfect fifth, a drifting third, four-note harmony, and two beats per second—all drawn and sounded live in BeamTracer Scope. There’s no background music: the notes you hear create the figure you see.
A tangled drawing does not automatically mean an unpleasant chord. Change one variable, then listen to what changed and watch what it draws. Every experiment below has a named Harmony preset you can recreate.
What does an oscilloscope actually show when you play two notes?
An X/Y oscilloscope plots two signal amplitudes against each other. Here, the left audio channel moves the dot horizontally; the right channel moves it vertically. The resulting line records where those two values take the dot over time.
The assignment is ours. C has no inherent horizontal direction, and G has no inherent vertical direction. Swap the channels and you swap the axes. The pitch comes from how quickly each signal repeats, not which direction we draw it.
This is a signal visualization, not a picture of a sound wave traveling through air. A cymatics experiment shows the response of a physical surface or fluid; an oscilloscope shows the electrical or digital signals supplied to its inputs. Those are different experiments.
Start with one motion
In EXPRESSION → PRESET → Harmony, Slow X only moves horizontally at 2 cycles per second. Slow Y only moves vertically at 3. Slow fifth — 2:3 combines them. These are teaching speeds below ordinary musical pitch; use the audible fifth preset for the listening comparison.
How can I hear and recreate a perfect fifth in Scope?
Choose C–G just fifth — 2:3 in Scope’s Expression presets. The preset generates C4 and a just-tuned G4 as stereo sine waves: about 261.63 Hz on X and 392.44 Hz on Y. You hear the notes while their relationship draws the figure.
- Open Scope and choose PERFORMANCE in the header.
- Expand Generators, then open EXPRESSION.
- In PRESET, choose C–G just fifth — 2:3 from Harmony. Selecting a preset starts its signal; begin with a comfortable listening volume.
- Leave CONTINUOUS PHASE enabled and keep the preset’s SPEED, A, B, and T RANGE unchanged for this comparison. Choose VECTOR DISPLAY under Scope Presets for the look shown here.
- Turn on SCOPE beneath the display, then MEAS in its panel header to see each channel’s measured frequency. Use STOP inside EXPRESSION when you finish listening.
- To save a moving demonstration with its notes, restart the preset and choose EXPORT → VIDEO → RECORD LIVE INPUT, then STOP RECORDING. Scope saves the video and sound together. For a still vector drawing, use EXPORT → SVG → EXPORT AS SVG; the glow stays in the display.
Watch and hear the just fifth — C4 and just G4:
The lower note completes two cycles while the upper completes three. After that shared interval, both return to the same phase and the path repeats. Written as upper frequency divided by lower frequency, the fifth is 3:2; written in X:Y order, this preset is 2:3.
A rational ratio can produce a closed sine-coordinate curve. Small integers make the shared repetition easy to follow, but the shape also depends on phase. Wolfram MathWorld’s Lissajous curve reference describes those relationships.
How does drawing speed become musical pitch?
Increasing SPEED makes the dot travel the same repeating path more often and raises the generated notes. If both coordinate frequencies increase by the same factor, their ratio stays fixed. Doubling the speed raises both notes by an octave while preserving the interval.
Start with Slow fifth — 2:3 at SPEED 0.01×: X completes two cycles per second and Y completes three. The entire figure repeats once per second. Set SPEED to 0.02× to double those motions; the figure repeats twice per second. Then choose C–G just fifth — 2:3 to hear the same relationship at musical pitch.
The audible preset's complete figure repeats about 130.81 times per second: it contains two C cycles and three G cycles per repetition. C itself remains about 261.63 Hz. A complete drawing's repetition rate is not necessarily the frequency of every note inside it.
Signal speed and screen speed are different
SPEED changes the generated signal and pitch. The display’s HZ readout describes screen redraws; PTS/FRAME describes a display point budget. Neither is the note frequency. Use SCOPE → MEAS to check the audible tones, and use the slow preset to follow the dot’s motion.
Should I use SCOPE or SWEEP to see the individual notes?
Use SCOPE to see left and right waveforms together, and SWEEP to inspect one channel over time. Keep the large X/Y figure visible above them: the same signal now has two useful representations.
On SCOPE, LEFT shows the C waveform and RIGHT shows G. Over the same time window, G oscillates one and a half times as quickly. The MEAS readout confirms the pitches rather than asking you to infer them from a decorative curve.
SWEEP shows amplitude against time for one channel. Its CH: LEFT button switches to CH: RIGHT. The horizontal direction now represents time, whereas the main X/Y display’s horizontal direction represents left-channel amplitude.
A waveform panel can move when its trigger chooses a different starting point. That motion does not, by itself, prove that the notes are out of tune. Keep the time window and trigger settings consistent when comparing signals; the triggering guide explains how to stabilize the display.
Can the same interval draw both a line and a circle?
Yes. Two equal-frequency sine waves draw a line when they are in phase and a circle when they are a quarter-cycle apart and have equal amplitudes. The interval remains a unison in both cases.
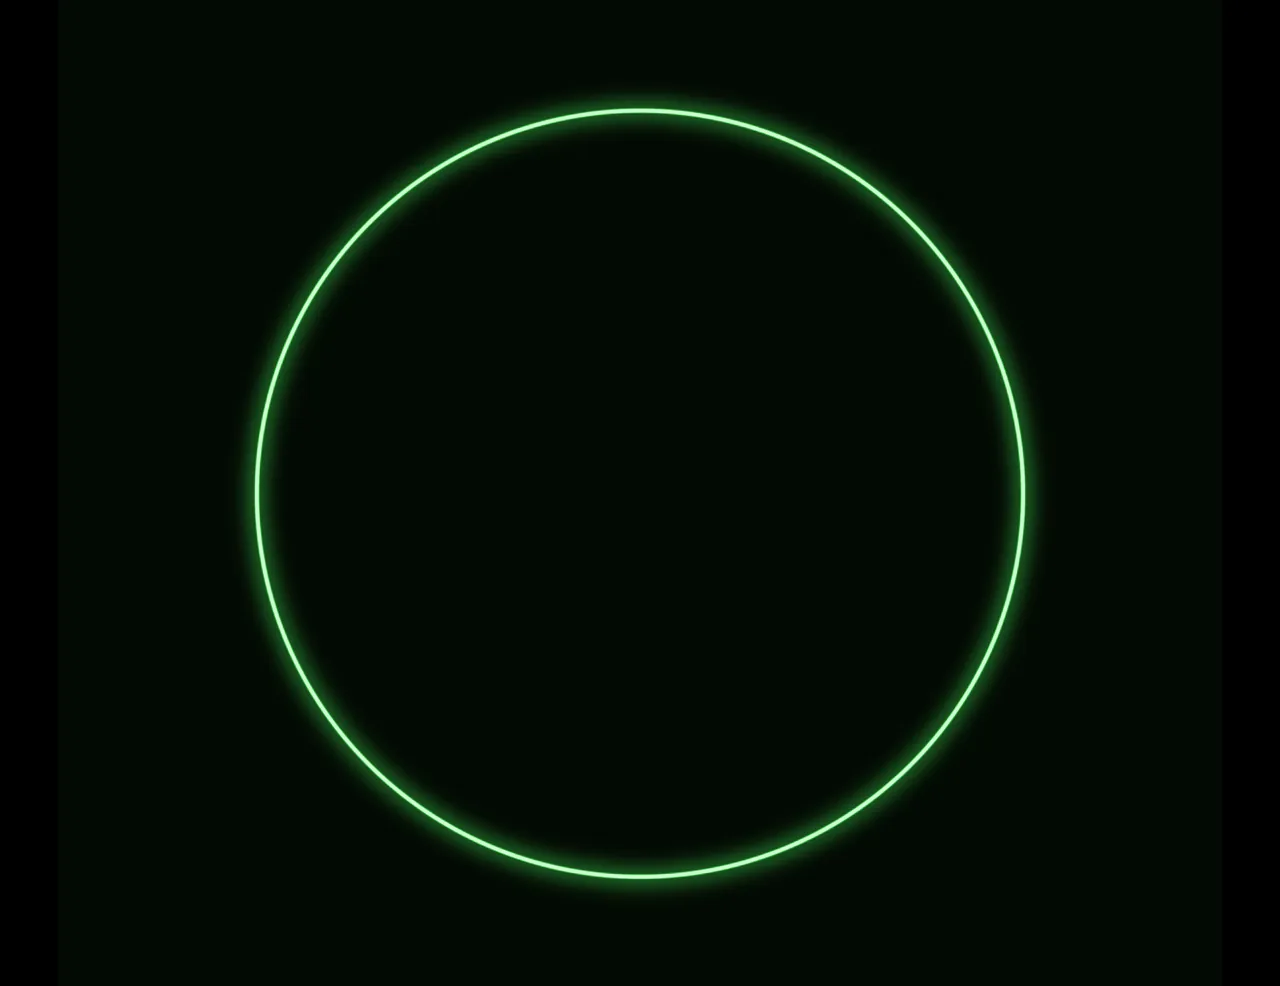
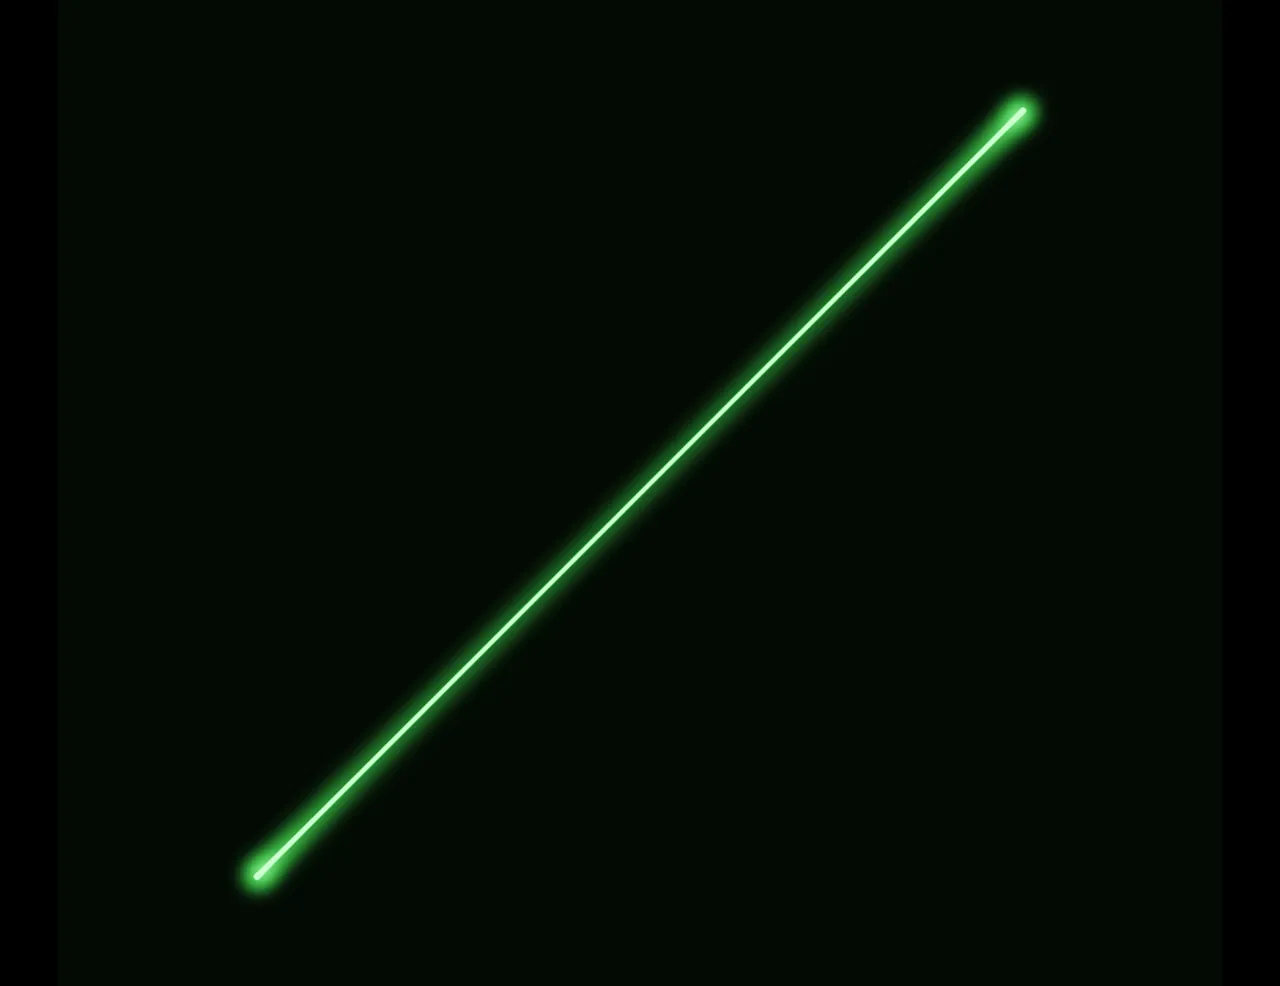 Same pitch, in phaseSame pitch, quarter-cycle offset
Try Same pitch — line, then Same pitch — circle under Harmony. The circle uses a cosine on Y, which shifts that sine motion by a quarter-cycle. Unequal amplitudes would stretch the circle into an ellipse.
This is why the drawing cannot be a universal consonance score. A change in relative phase can transform the figure without creating a new musical interval. Stereo phase can also affect what you hear when the channels mix, so keep your listening setup consistent.
Why does equal temperament look less stable than just intonation?
Just intonation uses selected rational frequency ratios. Twelve-tone equal temperament spaces the octave into twelve equal steps, with each semitone multiplying frequency by 2^(1/12). Its thirds and fifths are close to common just intervals, but do not have those exact ratios. UNSW’s note-frequency reference gives the equal-tempered relationship.
| Interval above C4 | Example just ratio | Just upper note | Equal-tempered upper note | Equal minus just |
|---|---|---|---|---|
| Major third, E4 | 5:4 | 327.03 Hz | 329.63 Hz | about +13.69 cents |
| Perfect fifth, G4 | 3:2 | 392.44 Hz | 392.00 Hz | about −1.96 cents |
| Major seventh, B4 | 15:8 | 490.55 Hz | 493.88 Hz | about +11.73 cents |
These examples use C4 at approximately 261.63 Hz with A4 = 440 Hz. A cent is one hundredth of an equal-tempered semitone. Just intonation has multiple interval choices; the table shows specific ratios, not one universal tuning for every musical context.
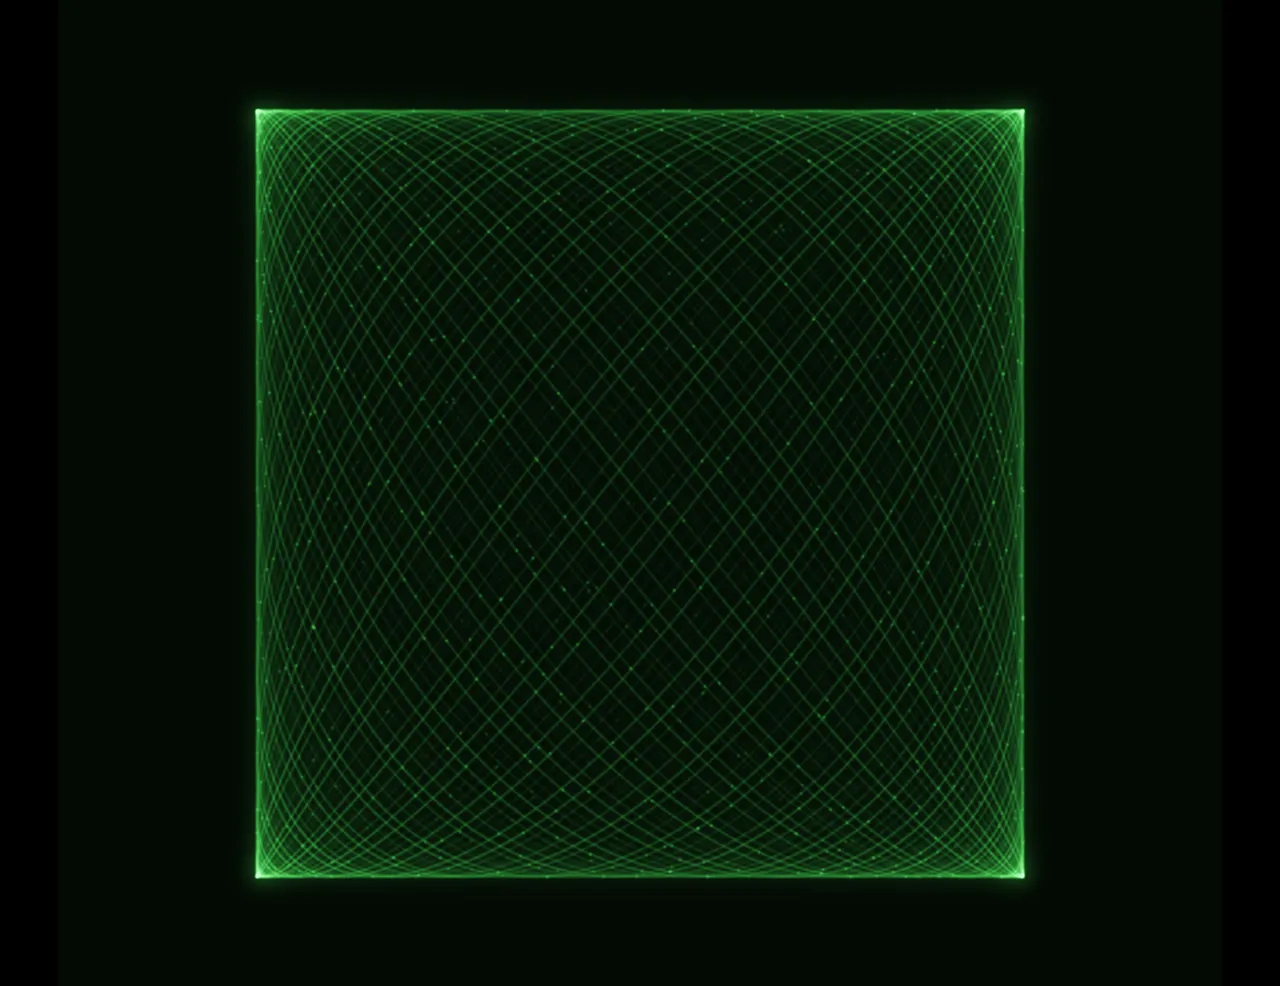
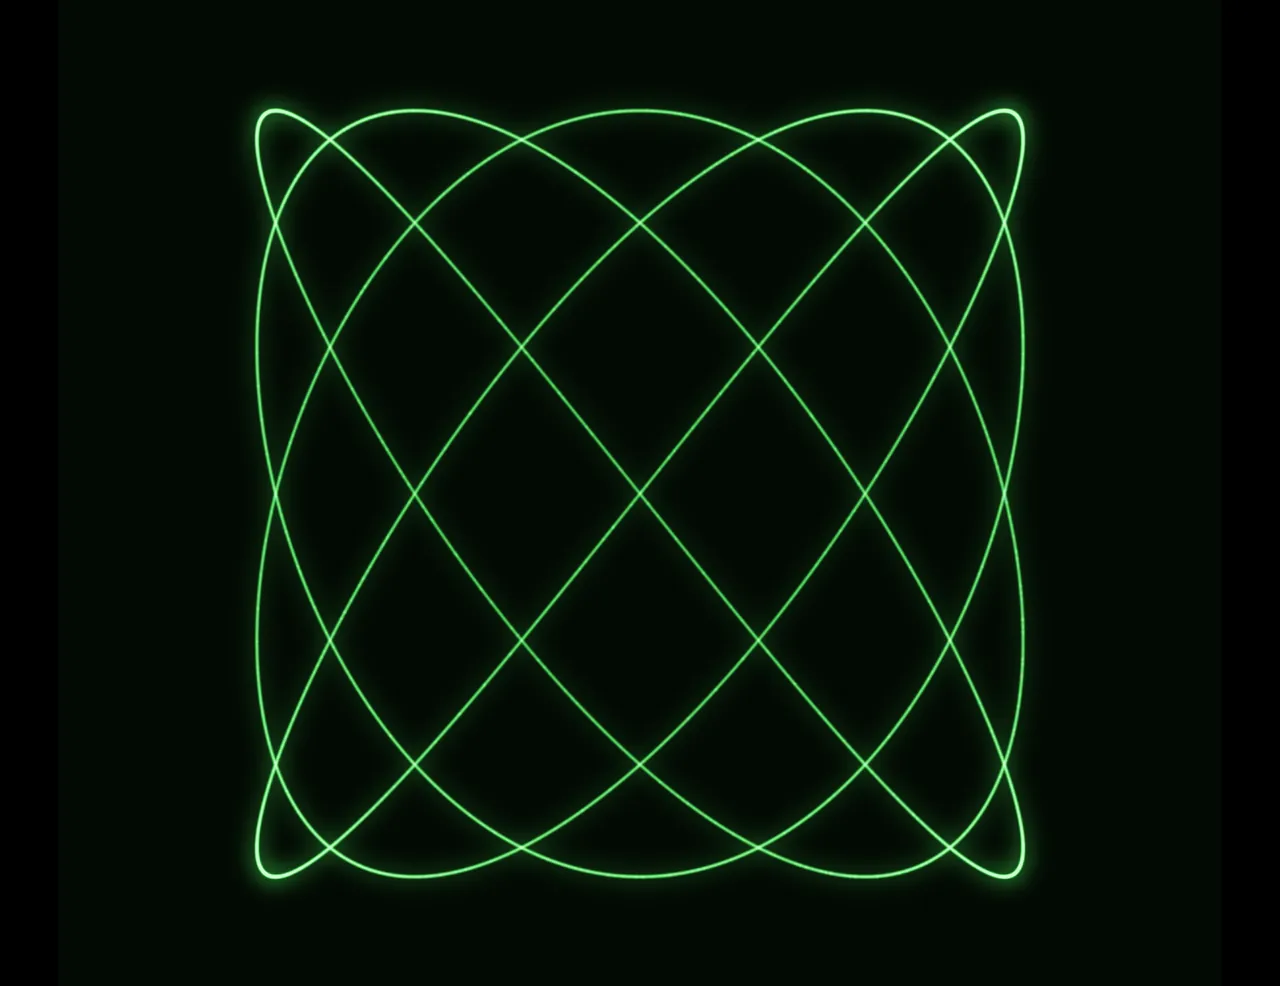 Just C–E thirdEqual-tempered C–E third
Watch and hear the just third:
Watch and hear the equal-tempered third:
Choose C–E just third — 4:5, then C–E equal third, without changing the display’s Persistence. The just curve repeats; the equal-tempered relationship keeps changing relative phase. Longer persistence retains more of those earlier paths, making the image denser.
CONTINUOUS PHASE lets that relationship evolve. Turning the option off repeats one drawing cycle, which can introduce a seam when an expression contains fractional frequencies. Leave it on for tuning and beat experiments.
A moving trace is not a wrong note
Equal temperament is a practical musical tuning system. Its moving trace is expected in this sine-wave experiment. A piano’s actual sound also includes harmonics, decay, and string behavior; this comparison models its interval ratios, not an acoustic piano recording.
The tradeoff involves more than visual neatness: a fixed keyboard has to serve many keys and harmonies. UNSW’s discussion of temperament explains why just intervals and equal temperament solve different musical problems.
What changes when a third note makes the figure three-dimensional?
A three-coordinate model assigns C, E, and G to X, Y, and Z. C major 3D — 4:5:6 uses one just major-triad relationship. Scope projects the resulting path onto the screen and combines those motions into audible stereo audio.
Watch and hear the spinning C-major triad:
To recreate the spinning view, choose C major 3D — 4:5:6, open 3D CAMERA, and turn AUTO-ROTATE ON. Keep ORTHO, select the Y axis, and set Speed to 1.0. Rotation reveals the curve’s depth instead of leaving one flat view.
The orthographic projection mixes the coordinate signals without depth-dependent scaling. As the camera rotates, the notes’ stereo gains change; you are hearing the same live projection you see. This moving mix is camera motion, not a change of tuning. The presets start with rotation off so you can make a controlled comparison.
Choose C major 3D — equal to compare equal-tempered C–E–G at the same camera and persistence. Its trace changes over time. Keep the camera fixed so you can distinguish tuning drift from rotation.
Does Cmaj7 require a fourth spatial dimension?
No. Four notes can be mapped into a lower-dimensional drawing. You need to explain the mapping, because different projections emphasize different relationships.
Scope’s Cmaj7 — projected 8:10:12:15 uses C, E, G, and B in a specific just-tuned ratio. C and B share the X coordinate; E drives Y and G drives Z. The orthographic camera creates a two-channel projection of those four tones. As the view rotates, each tone’s contribution to the stereo mix changes.
Watch and hear the spinning four-note projection:
For this clip, choose Cmaj7 — projected 8:10:12:15, then apply the same 3D CAMERA → AUTO-ROTATE ON, Y, Speed 1.0 settings. Stop rotation before comparing tunings.
This is one useful representation, not the unique shape of Cmaj7. Omitting G and plotting C–E–B would be a three-note voicing; combining two coordinate motions preserves the fourth tone in this experiment. Neither approach needs a claim about literal four-dimensional space.
Why can the same interval make a more complicated drawing?
Timbre changes the waveform. A pure sine wave contains one frequency; an instrument can contain a fundamental plus harmonics, along with an evolving envelope and other details. Those additions change both the sound and the path. OpenStax’s musical-sound chapter explains how harmonics contribute to timbre.
Watch and hear the fifth with added harmonics:
Compare C–G just fifth — 2:3 with C–G fifth — added harmonics. The second preset adds modest second and third harmonics to each note, with matched channel RMS levels over complete cycles. The fundamentals keep their 3:2 ratio, while the curve gains detail and the sound becomes richer.
That is a controlled timbre experiment, not a piano imitation. A real instrument’s spectrum, attack, decay, and tuning behavior can all affect the result.
Are beats and dissonance the same thing?
Beats are periodic changes in amplitude caused by interference between nearby frequencies. For ideal 200 Hz and 202 Hz tones, the beat rate is 2 Hz: the frequency difference. Scope’s Beats — 200 + 202 Hz preset makes that change visible as a varying radius.
Watch and hear the two beats per second:
Slow beating, acoustic roughness, harmonic relationships, and musical tension are related ideas with different meanings. Their effects depend on frequency spacing, register, spectrum, and context. UNSW’s beats demonstration connects the interference pattern with what listeners hear.
A dissonance can create anticipation, color, or a satisfying resolution. It is not a mistake. Research comparing listeners with different musical experience also finds that preferences for consonance vary across populations. McDermott and colleagues’ 2016 study helps distinguish responses to roughness from preferences for consonant chords.
Can I try these music-theory visuals without installing software?
Yes. Open Scope in your browser and use the Harmony Expression presets. Use SCOPE and SWEEP for the time-domain explanation, listen to the generated notes, and compare the large X/Y display. The examples use the standard controls rather than a separate drawing tool.
Change one variable at a time: frequency ratio, phase, timbre, or persistence. For chord tuning comparisons, leave the camera fixed. This turns a striking picture into an experiment you can explain and repeat.
Can these Scope figures be displayed with a laser?
Yes. Export a harmony figure from Scope as SVG, import it into BT Laser Studio’s Image to Laser, and convert it into laser artwork for a compatible projector and playback setup. The same relationship you explored with sound can become a projected vector drawing.
- In Scope, select C–G just fifth — 2:3, then choose EXPORT → SVG → EXPORT AS SVG.
- Open Image to Laser and load that SVG in IMAGE SOURCE.
- Inspect the preview and POINT BUDGET. Adjust SIMPLIFY if needed, comparing the result with the original curve.
- Choose Download ILDA to save the laser artwork for compatible playback. Use the ILDA Viewer to inspect the file before physical output.
SVG carries a snapshot of the path, not the sound, glow, or continuously changing tuning experiment. The exported laser drawing is not automatically synchronized to the generated notes. Laser scanning also has its own point budget and scan speed; those are separate from Scope’s signal speed and musical pitch.
Start with the simulator preview, then follow the laser safety guide for a suitable physical setup. Scope teaches the relationship; BT Laser Studio lets you carry that drawing into another medium.
The inspiration for this lesson is MichaelsMusicMind’s “What harmony looks like” post. The figures and note samples here were created with BeamTracer Scope’s generators. Try the presets, listen before judging the picture, and use the trace to ask a better question about the sound.